Hopefully this helps you put together the bigger picture, the transition between trend 1 and 2 and if you pay attention you'll find a lot of common market behavior and some interesting characteristics that show market action in a whole different light, the easiest way to understand it is to imagine that you were running a portfolio that had positions that amounted to a million dollar or tens of millions (or more) of dollars per position. This is how you can better understand why certain things happen so often and why there's an order to how they happen.
I'm not going to explain every chart, but I'll try to give you the important areas and timeframes, of course the longer the timeframe, the clearer the trend (that has some caveats, but not here).
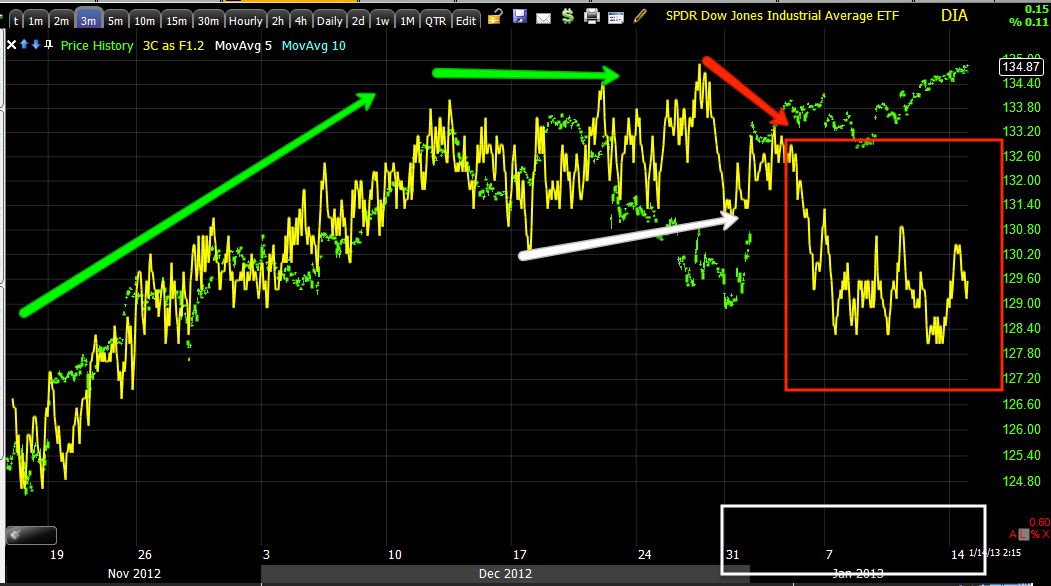
DIA 1 min trend, the 31st of December was the start of trend #1, you may see those dates highlighted below. Note the change in character around the 10th, that's when we moved above the 1/4 SPX highs and the area which I expected to see this kind of action.
2 min with both Trend #1 and the move above 1/4 highs highlighted
DIA 3 min, same
DIA 5 min, also same, remember the fastest charts will have the most defined divergences.
The 15 min shows to the left at the white arrow the 11/16 cycle lows, there was accumulation in to those lows, they started this cycle that I believe trend #1 is the end of.

This 4 hour chart is really not the trend we are looking to trade, but it does give the broad strokes and makes them very easy to see.
QQQ 1 min with Trend #1 and the move above the 1/4 highs
QQQ 2 min trend shows accumulation in to trend #q and then the negative divergence after the 10th-above 1/4 highs
QQQ 5 min, the depth of the leading negative divergence at trend #1 is why I think it's the end of this cycle since 11/16.
QQQ 15 min, the same could be said

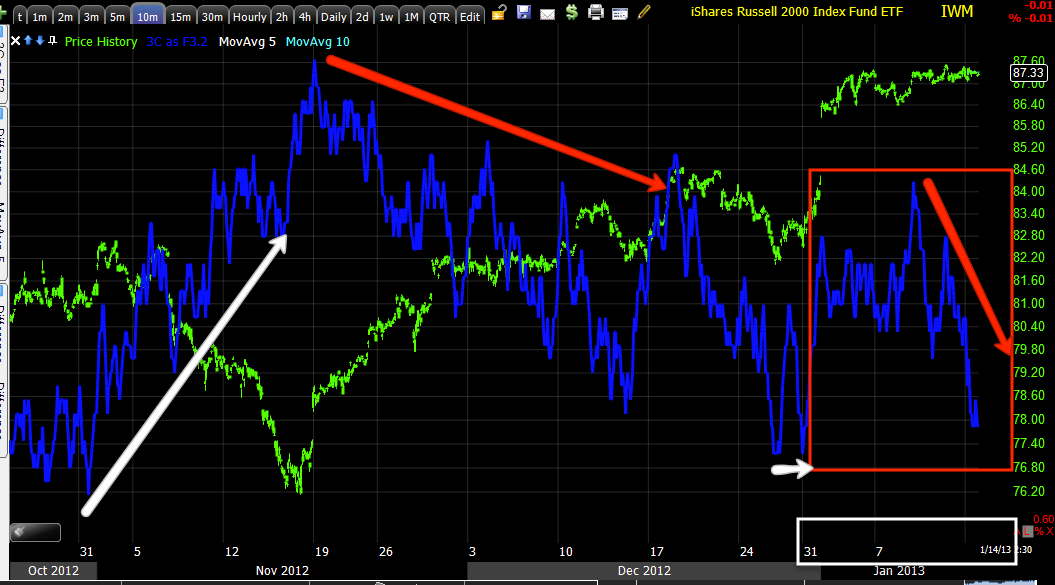
IWM 1 min trend
IWM 30 min trend from the 11/16 cycle lows
I don't know why this uploaded after the 30 min, but IWM 15 min at trend #1 and the move above 1/4 highs
IWM broad stroke on the 2 hour, this isn't anything we are trading, it just shows how far and serious this area of the divergence is.
SPY 2 min trend
SPY 3 min trend-again trend #1 and what happened after moving above the 1/4 highs is what's important here.
SPY 5 min trend of trend #1 specifically action above the 1/4 highs

SPY 10 min and the leading negative of trend #1

SPY 15 min and the leading negative of trend #1, this is why I think it's so important as the bridge between trend 1 and 2, trend 2 should cross below the 11/16 cycle lows


No comments:
Post a Comment