Monday, January 28, 2013

Taking TECL off

TECS is what made me decide as it is going positive much quicker than TECL is going negative, it's basically the same sign and not good.

Rotation in to Financials or Energy?

While Energy doesn't look as bad very near term as Financials, it does have a significant negative divergence on a long term chart.

As far as I can see, there's no rotation setting up in either financials or Energy, in fact they look pretty bad if anything which has me thinking about taking some off the table in TECL soon and thinking about as well as watching AAPL very closely.

Tech Update: TECL and AAPL long + TECS & QQQ

Friday looked like a rotation in to TEch, my opinion was this was based in some part on gap filling as there are quite a few in Tech and the tech heavy Q's. This led to positions Friday in AAPL calls as well as TECL, the 3x Tech long (as short term trades) and it was the right call as Financials and Energy are both in the red and Tech is in the green with profits in the AAPL calls as well as the TECL longs.

*Remember though, these were always intended to be short term trades. Interestingly, as we have seen the last 2 weeks with 3C calling the market average that would rotate in the next day very consistently, we saw the same with Tech on Friday, these make for short trades (duration), but it's the market structure that has come unglued from the normal "Risk on" or "Risk off" when all the averages either moved up together or down together. Some might say this is healthy rotation, but rotation is between sectors, not averages (at least not to this degree) and it isn't a 1 day affair, it's a short term trend. This looks more like the market cracking up.

As for Tech...
 XLK-Technology sector with the positive divergence, which was short in duration, the reason the trade ideas are also expected to be short in duration (but you have to take whatever the market is giving) and is already going negative on the price advance today, not so bad to turn things around just yet, but I don't like the volume I'm seeing in the sector.


 XLK 5 min shows the head fake move with the QQQ last week as a point of interest, but the main point is that the 5 min chart is exactly in line short term so this tells us how strong the accumulation of Tech was on Friday, it didn't reach the 5 min chart for the sector-again the reason why I warned these trades were to be considered short in duration and the reason for choosing leveraged vehicles like 3x long tech, TECL and AAPL calls.

TECL 3x long Tech (long trade from Friday)
 The accumulation out to 5 min on Friday and as it moves up today 3C turns flat.


 AAPL's short term 2 min chart's positive divergence and then it turning more negative as price moves up today.


 This 5 min positive in AAPL is much bigger than the chart above, this is why I chose Feb (monthly) Calls as I wasn't sure whether this would be a short term trade like what we saw in Tech or whether AAPL may add something more this week so I wanted the longer duration vehicle in case. I'm still undecided on that, but as you can see, the 5 min chart is still in good shape.


QQQ
 QQQ 1 min positive Friday and that look I mentioned earlier with a leading negative divergence and price looking like its climbing a wall of worry.

 The 2 min chart doing the exact same today


 As well as the 3 min QQQ chart

And as you can see everything is in line at 5 min, no positive, no negative, just in line and I'm waiting to see what it does.

As far as where I'd like to be whether this is shortly after the TECL (Tech long) trade is over of whether it takes a little more time to set up, I want to be in TECS, the 3x leveraged short Technology ETF.

As for the longer term charts or the strategic picture, they are already set up-10 min with a head fake move to the downside


 30 min positive leading

Even a 60 min positive with the 11/16 cycle lows at the green arrow.

I'll keep you informed on the positions in TECL and AAPL as well as anything else that pops up, I'll be looking to see if any other 1-day sector rotation sets up.

Some Interesting Signals

I hate to jump to longer term or bigger picture conclusions based on very early data, especially with such an important bigger picture (market reversal), but there are several things (which include damage done last week) that are raising some alerts (rather than alarm).

Commodities and credit aren't performing all that well right now, but this isn't what is really catching my attention. What is more important are the configuration of the signals in multiple averages and timeframes. This still doesn't change how I feel about short term long trades from Friday like TECL as this doesn't mean there's an immediate break starting now, but the way the signals are moving are like a much faster tide that is clearly moving out.

Here are some examples of what I mean, please keep in mind the damage already done last week as well as the longer term damage done throughout the entirety of trend #1.
 Damage done last week-DIA 10 min...

Trend 1 overall damage/tone on a DIA 60 min chart...

Although this is a very short term chart, it's the example it provides showing the difference between the character of even short term trade last week vs what we are already seeing this week.

Instead of just going negative or even showing a series of negatives which is bearish enough for underlying trade, this looks more like "Climbing in agony".

Here are some more examples, this seems to be more recent.

While many of you who are familiar with the types of divergences would probably look at these and think,

"They're leading negative divergences, What"s different about them?"

They have a loo of climbing in agony or something like trying to climb up a sand dune with the sand continually slipping out from under you. Most negative divergences see selling in to highs or the stronger ones will lead in to highs or price strength, I suppose it's not so much the divergence that's different as it is the way price looks, again, as if it is in agony trying to scale a slipping sand dune.

Why is this notable or important? Any change in character that stands out is always notable as changes in character lead to changes in trends.

Here the QQQ showed something similar last week when it finally broke above resistance highs that other averages had broken above a week earlier, it was quickly sold in to, this is similar to what we are seeing now.

 The SPY on a 5 min chart shows multiple negative divergences, some pulling price back more than others, but there's the start of this feel on this chart as well.

 Even on a 10 min chart there's a slight flavor of the same, although the more notable charts are earlier ones mostly from today.

 IWM 1 min positive that is sold in to immediately last week is definitely a negative sign, but it differs from what we are seeing today.

IWM 3 min is a leading negative divergence, yet again this is probably more about how price is reacting within a leading negative divergence than any real change in 3C, but it is a change of character.

Again, it's early and I don't want to jump to conclusions, but I also don't want to miss a key signal as each market has its own personality.

TECL Long Trade Update

Even though the NASDAQ 100 is just off flat for the day after losing opening highs, I still plan on keeping the TECL longs (this is the short term long position mentioned last night) open for the time being, a.m. trade is very volatile, but that's not to say there isn't a danger as the Q's too have seen broader weakness creep in from last week as well; all the same, the Technology long from Friday was meant to be a short term position.

 QQQ opening action as seen in the last post saw no early confirmation and the Q's lost quite a bit of ground since the open.

 QQQ 3min chart from last week.

 The much larger picture-30 min QQQ chart.

However TECL still maintains a decent 5 min positive which should still pop, at least to the gap.


Very Early Opening Indications...

It seems the same pre-market vs opening movement in the EUR/USD has not only put an early lid on oil, but has also played a supporting role in what looks to be non-confirmation in the market averages early on. I wouldn't read too much in to this as early a.m. action is full of volatility to run orders and stops, especially on a Monday morning, but taken with some of the more recent damage done last week, it's also not a great sign for the market.

 The EUR/USD was a bit stronger just before the 9:30 open in the US market, just after it was a bit weaker with the $USD moving in to the unchanged and then slightly green area.

 It looks like the early SPY 3C signal was not going to confirm anyway as that was the last posture of ES in pre-market as well.

 Last week, as mentioned last night, some wider recent damage was done to the market as can be seen in the continuing move in the 5 min leading negative SPY divergence, but more importantly...

 A sharp move in the near term 15 min chart shows that this was real damage.

 Here's the DIA's 1 min open which looked set to confirm with a late Friday positive divergence.

 The IWM on the other hand saw no positives late Friday even on the shortest 1 min timeframe and has not seen confirmation of this morning's price action as of yet.

 The Q's also are not seeing early confirmation.

This is much too early to make any assumptions about a sustainable trend, it's just interesting given the overnight action was so seemingly purposefully flat.

Crude seemingly not concerned with protests in Egypt

Recent protests have broken out again in Tahir square, more broadly Cairo, Suez and a few other large Egyptian cities. While the initial catalyst may have been the 21 death sentences handed out for a deadly riot at a soccer stadium, it seems the tone has turned decidedly more anti-Morsi as he continues to consolidate powers that have many comparing the first democratically elected leader in Egypt 
 (typically the military is the real power behind who is elected, but that ended with Mubarak) to a Pharaoh. 

Morsi may have added more fuel to that fire by imposing 9 pm to 6 am curfews on several of Egypt's largest cities in response to the demonstrations and clashes with law enforcement. However for the time being, it seems oil is more concerned with arbitrage calculations than a "People vs the Government", Arab Spring part 2 so far.

As you saw in the last post, the EUR/USD was moving up, meaning the $USD was moving down, although now starting to recover. Crude looked like it was much more interested in following that relationship as you can see in Crude futures...

Crude futures follow the EUR/USD in pre-market...

However as the market opened the $USD gained some strength to move to the green by +0.05% and eC did not confirm the gap up in USO in early trade, which has seen USO lose about 1/3 of its gains since the open , now at +0.40%.

Perhaps more interesting for the moment is the fact the protests have not raised alarm that Morsi is in any real trouble or peril of facing Mubarak's fate.


Pre-Market Futures

Pre-market futures for the equity indices are flat-ish, there are a few that look to see slight upside gaps, but the theme of the night as best illustrated with the NASDAQ futures seems to have been to keep the futures flat, either giving them support to keep them from falling or spooling out some supply to keep them from rising, but in actuality, it looks more like the adjustments were specifically to keep futures flat as both acts seem to be present. The European open didn't even move futures much as I expected it would not last night.

 NASDAQ futures with the European open at the green arrow, a very flat range overnight. Note the support (positive divergence in white) and resistance or supply (negative divergence in red).


Pretty much the same can be said of SPX futures where no theme was allowed to break lose all night. It seems someone was interested in a flat opening this a.m.

Perhaps FX gives us a hint of early action...
 The EUR/USD opening for the new week has been flat as well...


However some very recent upside momentum, although still small, may be a hint as to which way early trade will break.

Sunday, January 27, 2013

The Week Ahead

Last week the theme was the macro economic data was turning  south as several Economic surprise indices have been turning consistently negative, even as we are in the prime of the arbitrary "Seasonal Adjustment" period. During Q1 2012, the seasonal adjustments made macro-economic data look strong, however if you looked beyond the head lines in to the very same reports, there were clear signs of trouble and that the data was being massaged with arbitrary, goal-seeking seasonal adjustments. For example, while the headline print may have looked strong and that's as far as most traders read as well as the headline scanning algos, the devil was clearly in the details as shrinking profit margins or a margin squeeze was very evident.

Armed with this evidence and 3C signals, we spent most of March, all of April and May 1st putting together and filling out our core short positions, of which we had 9 and by the June 2012 lows, all 9 were at double digit profits from our entries in Q1 as the market turned down virtually the same time the seasonal adjustment period ended.

Last week we already saw signs of even the headline numbers turning down, amidst the height of the seasonal adjustment period. While not exactly a seasonal adjustment, last week's Initial Claims looked pretty good until one realized that not only were 3 states including the most populous in the nation, California, all estimated (due to the holiday shortened week), but beyond that there were more people dropping off extended benefits than the Initial Claims, meaning the data was deeply skewed without context and misunderstood. This week's revised reading for last week (which is virtually guaranteed as it happens about 95% of the time) will almost certainly be worse, but that will only give the mainstream financial media the opportunity to contrast this week's number vs. a worse  revised reading from last week (as we have seen the media do time after time for whatever agenda they are pushing-it is not unbiased analysis though), allowing them to make the claim that there's improvement in the current reading vs last week's number  as no one cares about last week's revised number which is buried far from the headlines other than the current weak beat the negatively revised number.

Still, the point is that the macro economic data is deteriorating badly and much earlier than last year which saw the market fall as soon as we went from seasonally adjusted to the normal readings with no arbitrary adjustment, leaving many with no chair when the music stopped. This poor data is what we are seeing now, despite what the general conventional thinking is, look at the 4 consecutive F_E_D manufacturing readings, all worse, many hitting multi-year lows and all showing contraction in US manufacturing. If one goes on to read the details, the sub-indexes also show many individual components deteriorating, interestingly one of the big ones is the employment index which is deteriorating-although this is a different way to read unemployment (through F_E_D manufacturing surveys rather than BLS data). I doubt very much that this trend underway is temporary noise, thus I don't expect improvement.

If you follow some data, but not all, this may sound confusing as a rosy picture is being painted in the US and Europe, but if you dig in to the details and compare actual reports vs confidence indicators which are arbitrary, you'll see there's a deep divide between what is being sold and what can actually be observed.

This week's AAII (American Association of Individual Investors) sentiment survey hit a startling new bull/bear spread. Historical data has shown that when the spread of bullish respondents has at least an +18 point spread above bearish sentiment responses, we are at a bearish reversal point-18 points being a fairly healthy spread, not anywhere near the average. Take a look at this week's AAII investor sentiment report which is a great reverse indicator when at extreme levels (18 point spread being defined as extreme which has shown real moves in the market)...

The long term average spread is 8.5 points, this week jumped over 11.5 points to a spread of 28!

"Right Side Of TheChart" took the time to take the historical data from AAI's website and superimpose bullish spreads of +18 or more on the SPX and bearish spreads of 18 or less (the first depicting bearish reversals and the second depicting bullish reversals) and here's what it looked like.


Note the "*Dual buy or sell signals in close proximity often result in major market tops"  note at the top left of the chart. This week's 28 point reading is the third. To those who think about it, this is a dumb money sentiment indication, one we saw last week in net long positioning hitting extremes/multi-year highs.

For the thoughtful, it's obvious that dumb money and smart money can't be on the same side of the boat and expect smart money to make profits, they need someone to trade against in a zero-sum game, but for those experienced in market behavior from years of careful observation, the reason is more insidious, it all comes back to the head fake move and the reasons for them. With the SPX breaking above the psychological level of $1500 (as a magnet and as a sub-consious centennial number-think about shopping and prices at $14.99 rather than $15.00) the reason is more often than not, the setting of bull or bear traps which act as accelerators to reversal moves with little to no cash outlay on smart money's side one the trap is set. Think about this for a moment, the 2002-2003 bull market start to the 2007 top took 5 years, to erase all of those gains and then some it took about 16 months with most of the damage coming in 8 months, part of the reasons is fear is stronger than greed, but another part is the setting of bull traps that create fast losses and fast moves to the downside as additional losses multiply exponentially- the market crossing $1500 brings in a lot of dumb money. You can read more about this in the first two installments of the 3 part series, "Understanding the Head-Fake Move"

Part 1

Part 2

The truly scary thing about SPX $1500 is the change in price vs the change in the real economy. The 2002-2007 bull market was fueled by consumer spending which was fueled by rising property values and the HELOC. Looking at the market today vs even the top in 2007, we were in a  much better economic position at the top, even though it was painfully obvious there was a bubble about to burst in a big way, but the jobs, the manufacturing, the global economy were all still there and intact, that's the difference now, which may be the reasons "Trend #2" looks so bad in comparison to trend #1 which is stronger than we anticipated just as I predicted, what does that tell us of trend #2?

In any case, Here's the open of the FX market tonight...
 This is the breakout from the triangle in the EUR/USd we have been talking about over the last week or two, I said it wouldn't be a clean cut affair, it looks that way now, but it won't for long, this is just the nature of the markets and especially when we are near a very narrow area of very important support and resistance as we are at the apex of a triangle like this, the move to take out support doesn't have to be as big when the apex is so narrow. I do suspect this to be a head fake move in the EUR/USD, it's also a move I have been expecting and I don't think its importance is nearly fully realized yet.
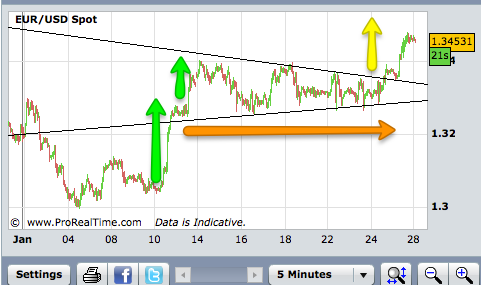
 I first became concerned with the two parabolic moves up in the Euro, after that there was no follow through, this was a warning, then Goldman coming out with a long EUR/USd call for the general public as the last 3 major calls they have made have all gone the other way, not because they are wrong in their analysis, but because they are using the call to accomplish a goal, if you are a buyer of the EUR/USD don't be surprised if you are buying from GS.

 This is what Technical Analysis expects from the price pattern in the EUR/USD, this is what they have received, this is also the easiest way to set a bull trap because dumb money using technical analysis is already expecting this to happen so they will buy it with little hesitation, again see the two part article linked above, specifically part 1 in this instance.

 Here's the opening of trade for the FX pair for the week ...

 The breakout and then support at the triangle not only confirms this is what technical traders are looking at, but it has done everything TA says it should, the thing is TA has been used against technical traders for the last 10 years with increasing frequency.

And the long term daily view of the trend in the EUR/USD which reflects the problems in the EU which have not been solved.

In fact, the re-payment of LTRO loans in greater amounts than expected may indeed start to send sovereign yields up creating a new panic in the EU as early as this week.

This is what ES looked like about an hour ago, it's really not doing much presently and is a few points below Friday's 4 pm close, I don't read much in to this right now as there are few major markets open like bonds, etc.


ES has deteriorated a bit since the capture, as I said I wouldn't read much in to it.

Last week we saw deterioration in to the major averages in the important timeframes, not only long term/big picture, but longer timeframes short term which is worse for the smaller picture or immediate future.

I did see some very short term positive signals and that' why there were some short term long treads offered up late last week, but I expect these to be very short, possibly even closed out tomorrow. I still feel there's a very high probability that the reversal starts with what looks like a very strong day and quickly turns to a very negative day, this being the actual start of a reversal. One thing you may want to watch carefully for would be signs of the market trend vs the TICK indications, if the market trend is positive and the TICK data on a 1 min chart diverges negatively from the market, this is a major red flag, but I suspect we'll have many other signals first.

Some of you sent emails this weekend and I need to finish several of them, I wanted you to know that I do have them, I will respond to them.

As always, if anything changes tonight in futures, I'll let you know, but I don't expect any changes until pre-market or possibly around 3 a.m.

If you took any of last week's long trades, please keep up with the updates on those trades, they were all entered with the idea of them being very short term, but perhaps very profitable which is in line with the intraday/fast reversal I've suspected.


The Truth About the Playing Field We Call the Market and the Odd City of Boca Raton

For some time there was an effort under way, more like propaganda, to convince all of these newly found would be self made traders around the time there was a major shift in the market that changed everything tight up to the way we trade this very day.

As the Internet revolution destroyed the client /broker relationship of old (and $80 1-way trades carried out by brokers who knew little about the market and were instead given a list of assets to push on their clients like the salesman they were, rather than seasoned market participants) and brought about the new Internet inspired age of discount brokers, there was an effort to convince people the market had been cleaned up, the waters were safe for the small investor, that manipulation of the markets was something of Jesse Livermore's day and the manipulation of the 1980's characterized by Gorden Gecko had been stamped out as well.I believe the SEC brought few insider trading cases because it undermined the faith in the new industry of discount online brokers. For the ultra-rich, the rise of the Hedge Fund was meteoric around the same time. The only cases the SEC went after were high profile cases like Martha Stewart who was likely the very least of the corruption in the market, but she was well known and like the way the IRS went after movie stars, the SEC went after a household name, all to convince the new self-made traders that the playing field was level; likely in reality Martha's crimes were a drop in the bucket compared to what really went on and still does.

We at Wolf on Wall Street know different than most, not because of guesses or hunches, but because we've been able to effectively use this manipulation we see in underlying trade to our advantage by following the footsteps of smart money.

Toward the end of the week (last week) a new insider trading case broke, once again it was in the ripe for inside information sector of bio-technology.

Did this case break in New York or Chicago? No, it broke in a smaller city, one in which I spent most of my life and one packed to the gills with money, Boca Raton; the same Boca Raton of Seinfeld fame.

While I've met with several smaller hedge fund managers and have worked with other financial institutions on possible collaborations, it's hardly a hub like New York, however for an affluent, smaller town, it is one with some interesting history. 

Boca Raton was one of the first "Resorts for the rich" dating back to the 1920's when Jesse Livermore himself was among a group of investors including famed architect, Addison Mizner (which is a name seen everywhere in the city from streets to parks, to restaurants, gated communities, storage facilities -anything the name will fit on) who invested in the infrastructure and an expensive hotel that would only decades later become the ultra-rick city it is now, with every other car being a Hummer, Ferrari, or some other obnoxiously colored status symbol on 4 wheels.

We also were front and center in the 9-11 attacks as the attackers spent time in the area, in fact while I was living 1 city south of Boca during this time of great tragedy, I recall the FBI coming in to every local restaurant and bar on the small island of Deerfield beach in which I had resided, confiscating all of the security camera footage. Then one night I saw the small "Black Panther" 2 story hotel on the news with news of the terrorists having stayed there (thus the reason the FBI was confiscating tapes from every business in the area).  I recognized the hotel as it was only 6 blocks from where I lived. We skateboarded down there to see all kinds of investigative teams as well as a body bag being taken out, the story at the time was one of the high-jackers had lost his nerve and was murdered by the others; that night was the last I heard of the story, but we did see the body bag with our own eyes.

Days later a story broke that the high-jackers had been using SunTrust bank in south Florida, a place where my fiance (now ex-wife) was a teller.Along with the front page article were the pictures of the known high-jackers, one of which my wife had recognized as someone she served at her branch that she remembered (as do I as she came home that night to tell me how rude this customer had been to her) as he had cashed a bad check and the branch manager foolishly, actually went to their place of residence looking to recover the funds, but found it empty. 

Soon after, The National Enquirer which is located not 6 miles from where I lived received the first deadly anthrax attack and our postal substation was shut down as traces were found on the equipment-another story that disappeared for quite a log time and as far as I know is still unresolved. A lot of interesting things have occurred in small Boca Raton.

This week we get news of a financial advisor arrested for tipping off a childhood friend about Gilead Sciences (GILD) and an impending $11 billion dollar pharmaceutical deal. 

This wasn't a huge deal, the inside information was sold in exchange for $35,000 and (get this) a wooden dock to be built to hold his jet skis, which tells me that these sorts of insider transactions are pretty common just judging by the relatively small payout the tipster was looking for while risking his very freedom. Do you get where I'm going with this? The amount of "Payolla" was so minimal vs. the possible repercussions, it sounds like this is business as usual and that they had very little fear of being investigated by what many would call a toothless SEC, although I have noted here on these pages a recent increase in SEC activity since Obama was re-eelected, considering Wall Street gave 4 times more money to the Republican challenger this presidential election over the incumbent, I'd guess the SEC has been unleashed in a sort of payback.

The childhood friend who got the inside information made a modest $163,000 profit as Pharmasset was sold to Gilead Sciences Inc., again indicating that even small deals and insider information like this are quite common and those with the knowledge and those acting on it, are doing so in ways in which the potential gains vs. the potential penalty seem trivial, yet there seems to be a culture of every day corruption like this, an air of business as usual. 

This is why I have no interest whatsoever in insider information, I'm not interested in jail time, but I am very interested in what underlying trade tells us as MACD, RSI or any of the mainstay indicators of Technical Analysis can't look at what is happening below the surface, they can only see what is happening after the move has been made and it's registering in price action, by then a good portion of the gains are long gone.

I find the story interesting because it's right in my backyard, but I also find it interesting because it was NOT a big story or a huge multi-million, 7 or 8 figure deal. It wasn't a "large" scam of inside information, the small size of the money involved sounds very much like this is a culture that ranges from top to the very bottom including small financial advisors rather than the largest of hedge funds and because it was so casually carried out with so little regard for consequences. I think this tells us a bit more about the true nature of the playing field and I'd much rather have the knowledge of what moves smart money is making while others remain totally clueless than chasing trades via indicators that reflect a move that was planned out months before and has already given up a substantial amount of the gains.