Tuesday, April 2, 2013

QQQ $68 weekly call P/L

Here's the P/L on yesterday's position opening weekly QQQ $68 Calls (expiration 4/12)


At a cost of $1.01 and a fill of $1.40, yesterday's QQQ position brought in almost +39%. I closed half the position because of momentum and held half because I think there's some more to go. Either way, 38+% for a day isn't too shabby.


 QQQ 1 min from yesterday, this morning there's an intraday negative divergence.

 Since it was on the 2 min chart as well that made the probabilities of a pullback and loss of momentum higher, in fact momentum has started to fall off.

The 15 min chart is still moving toward confirmation so I have no problem leaving part of the position open after having taken some initial profits.

Closing Half of weekly QQQ $68 Call Expiration 12th

Market Update

Again, as was pointed out last night in the last post, "Market Update-Futures-AAPL" Context's SPY Arbitrage model was positive all day, this is what it looked like in last night's post (yesterday's model)

 This is yesterday's SPY arbitrage model and one of many reasons I posted this yesterday...

"I've just gone through a boatload of charts and while there is serious damage done to the market structure, this appears to be nothing more than a short term consolidation/pullback." (Click link to see yesterday's post)

So far this morning (even though the model is delayed by 30+ mins., we do see a positive arbitrage SPY model again today as suspected with a +$.40 differential as of 9:35 a.m.

Again from last night's post, "Risk assets such as HYG, JNK and DHY all had a stronger close than the SPX, "

HYG, TLT and to a lesser degree, VXX all closed better than the SPX, hinting at arbitrage assets being used yesterday.

Despite the weaker Euro and stronger $USD today...
 Euro vs SPX not supportive...

 USD vs SPX also not supportive, yet the market is higher.

$AUD, after last night's RBA decision to leave the cash rate at 3%, the $AUD is in line and supportive of the SPX. More on the RBA decision which was covered last night here.

So far among the market averages we have a small intraday 1-2 min negative in the SPY, that should lead to a correction/pullback, the DIA is holding up pretty well, the Q's have a slight intraday negative divergence, should lead to a price pullback intraday and yesterday's worst performer, the IWM which I mentioned last night had the most bullish P/V dominant relationship among its component stocks is in line intraday.

AAPL Update

AAPL is a difficult divergence to understand, there was no warning early on yesterday that it would make a move lower as it did which I believe to be part of a stop run for not only AAPL, but the entire NDX 100 or QQQ, but just as I showed the divergence last night and it's positive character which is difficult to understand on several timeframes, this morning AAPL is moving in line with those positive divergences I showed at the end of this post last night. This is why I was able to keep faith in the position from yesterday.

Here's a look as best as I can explain for now until we have more time under the bridge.

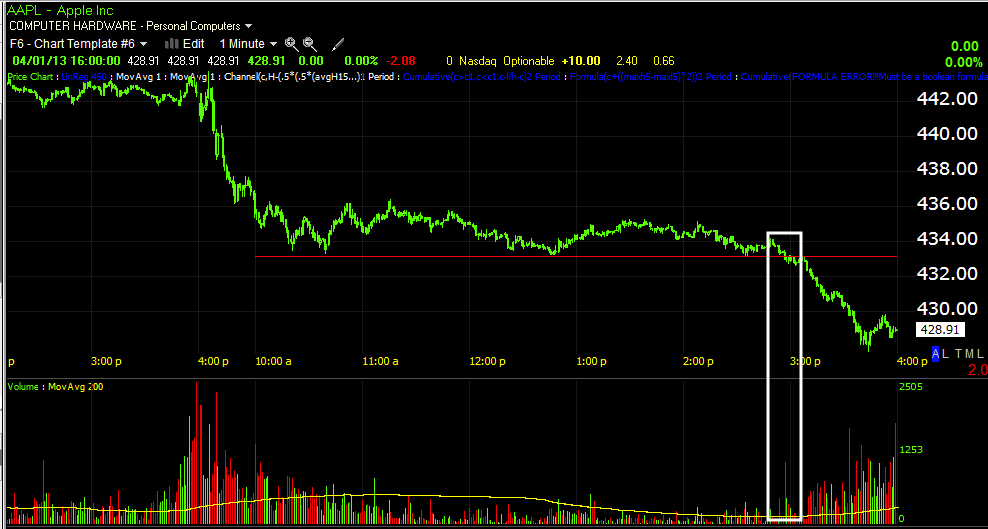
 AAPL's stop run yesterday afternoon, also new shorts would have entered and caught this morning with a loss as AAPL moved back up above the resistance area (red trendline), AAPL is now up +1.37 and the Q's +.75%.

 This 3 min chart does show 2 leading positive divergences, those are real, they are there, the underlying activity was there, it seems all institutional support was pulled so AAPL could hit stops, BUT this 3 min chart NEVER WENT NEGATIVE, it remained in line with price action.

 This 5 min chart shows a leading positive divergence and it did happen, when support was pulled as AAPL broke down and triggered stops, again, THIS 5 MIN CHART NEVER WENT TO A NEGATIVE DIVERGENCE, BUT REMAINED IN LINE.

 The faster 1, 2 and 3 min charts show accumulation picked up again once AAPL had taken out stops as you might imagine as prices were lower and supply was more plentiful for institutions to fill larger orders without driving price against their positions.

 This is one of those times that the divergences on the 3 and 5 min charts appear as an accrual on a longer chart such as this 10 min or...

 This 15 min which are more important timeframes. When you see positive divergences in a choppy manner you have to check the longer charts to see if those shorter term charts with choppy divergences (rather than a smooth continuous one) accrue on a longer term chart as they did  here.
 
The 1 min chart showing accumulation of the lows, this wasn't heavy enough to move past the 2 min chart because it was a shorter period, but it was there.

When AAPL is done and we have more time and the move under the bridge, it will be easier to see, but this is the concept of "accrual" which is one of the more difficult ones, but just think of it as institutional accumulation in spurts and the accumulated shares are put aside, the indicator may fall and another positive divergence will appear, more shares are put aside, that's an accrual of shares and it typically will show up on a longer term chart as it did on the 10 and 15 min in AAPL yesterday.

Overnight and Pre-Market

This morning you will see something very clearly, something that you might not have realized before had so much power and such a strong correlation that it could drive the futures by itself. What am I talking about? The Cost of Carry.

Overnight there wasn't anything special out of Europe to send futures higher, in fact Italy's Monte Pacshi was halted as European trade opened overnight for the week (remember yesterday Europe and Great Britain were closed due to Easter) on news that they were one of the first non-Cypriot banks to experience a bank run due to the Cypriot mess. Unemployment in Europe hit 12%. Final Manufacturing PMIs for Germany, France, Spain, Italy and the Euro-area were all i contraction below 50 and even worse for the PIIGS countries. Italian PMI fell  to 44.5 from the Flash of 45.8,  Spain's PMI fell to 44.2, vs flash 46.2 and 46.8 last, UK 48.3 vs Flash 48.7, Germany 49.0 vs Flash 48.9 down from 50.3; France 44.0 vs Flash 43.9.

In fact, it got even worse with Slovenia's #2 at their Central Bank saying, "Slovenia must start credible measures to avoid aid."

Overnight there were rumors that Cyprus' Finance Minister was going to be kicked to the curb, this morning he has turned in his resignation and it has been accepted in the midst of ongoing investigations...? Investigations of the Finance Minister?


"Negotiations were completed today, with considerable success for these objectives", the President says, adding that "it is, however, something that particularly appreciate, but I want to exclude from the resignation by Mr. Sarris is the high political ethos and politics sensitivity demonstrated. "
"The decision of Mr. Sarris submit his resignation for reasons of political touchiness, to facilitate the work of the Investigation Committee, is a cultural phenomenon in the life of the Cypriot political life", says President Anastasiadis.

Are we about to hear that it wasn't only the President and his family that sent their money to London a day ahead of the Troika confiscation?

No, the news out of Europe overnight was no reason to ramp the market. It wasn't the EUR/USD either, not amidst this news...
EUR/USD falling all night since about 9 p.m. EDT.

So what was it, the very sensitive (apparently) cost of carry. Here's the Carry pair USD/JPY...
This is a multi-day chart going back to Friday to present, the USD/JPY was falling, meaning the cost of carry was increasing and at up to 200:1 leverage, every pip (the smallest unit of measurement that FX is typically quoted in down to the 4th decimal point) counts! Note the recent change sending the pair up and the cost of carry down on this 5 min. chart.
Here's the same pair on a 1 min chart overnight since 8 p.m. EDT at the far left, around 11:30 the pair hit its low and from there the cost of carry fell all night sending the futures market higher.

 ES 1 min in line overnight with a negative divergence pre-market, however...

 The more important 5 min chart has come in to line, just like the market averages' 3C charts suggested yesterday (as seen in last night's last post).

 NQ/NASDAQ 100 futures 1 min chart ramped all night and is seeing a negative 1 min divergence pre-market, but...

 again the 5 min chart is strong and that's all that really matters for now.

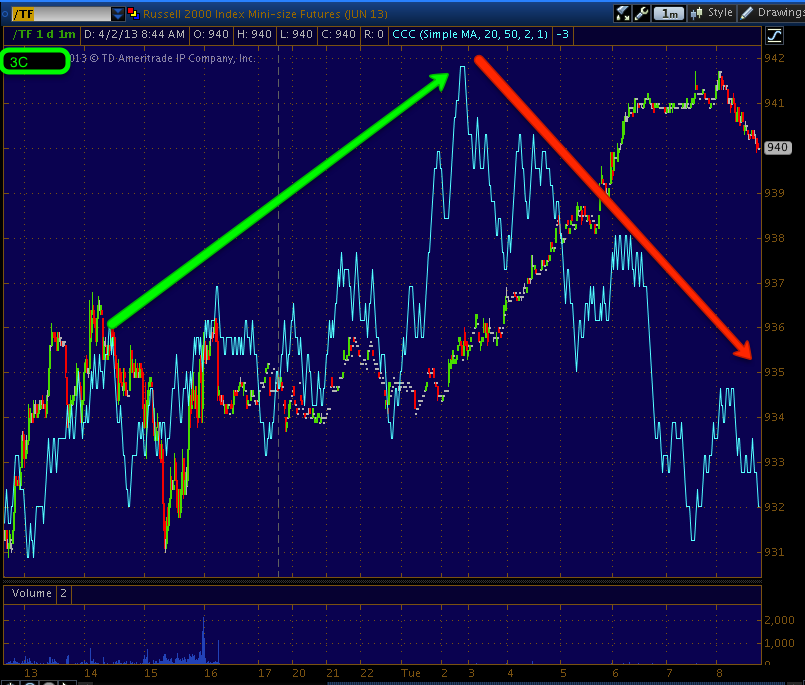
 TF/Russell 2000 Futures also ramped all night as yesterday afternoon's leading positive divergence suggested. Again there's a negative 1 min divergence pre-market, but...

Again the 5 min chart which is all that really matters is in line just as the IWM charts posted last night suggested.

Now you can see how very sensitive the market is to the cost of carry as it fell, it was used to finance the overnight ramp in real time.


Market Update-Futures-AAPL

The RBA decision is in about 30 mins, I have seen a few changes in the $AUD FX pairs since the last update, for instance AUD/CAD was seeing some negative action, it has now moved to a leading positive divergence. However, AUD/SGD, AUD/CHF and AUD/NZD have weakened pretty significantly and AUD/USD and EUR/AUD have weakened, but to a lesser degree.

As for futures, earlier today I said in this post, Market Pullback/Consolidation...      

"I've just gone through a boatload of charts and while there is serious damage done to the market structure, this appears to be nothing more than a short term consolidation/pullback."

Basically I see today's action as a short term pullback or consolidation before the market heads higher.

Tonight's futures thus far are confirming the earlier post which was followed up with numerous charts showing why I believe what I said above...

Here are the futures thus far tonight...
 The EUR/USD is showing a bit of near term weakness, it isn't so bad yet that I'd be calling for a Euro pullback at this point, but if the pair was very interesting to me, I'd want to keep a pretty close eye on it.

 ES has not only shown a leading positive divergence at what I described earlier as a small double bottom on an intraday timeframe as stops were run, but since the leading positive divergence has grown pretty substantially.

 The NQ/NASDAQ 100 futures 5 min chart shows earlier weakness and negative divergences, but since late in the day during normal market hours it has shown a strengthening positive divergence that was starting to lead, it is now leading positive substantially and this is a pretty strong timeframe for overnight markets.

TF 1 min (Russell 2000 Futures) were working on a leading positive divergence most of the day during regular hours, it has continued to add to that leading positive divergence in after hours futures trade.

At the same time the move in the JPY/Yen has been substantial, I imagine some of this is short squeeze, but that would only put more pain on open or remaining carry trades so they'd likely see some more funds moving to close the positions, this paints a bleaker longer term market picture.

 EUR/JPY 5 min chart with the Euro's losses vs the Yen's substantial gains today.

 The longer term daily trend breaking down in the EUR/JPY

 USD/JPY 5 min losses since FX opened for the week, this means the 4uSD lost some ground, but the real thrust of the move has been the upside the Yen has gained either vs the $USD or just on its own.

 The $USD/JPY downtrend, this is NOT what anyone engaged in a USD/JPY carry trade wants to see as it means significant losses to the pair that's used to fund equity and other risk asset purchases.

The daily USD/JPY trend is breaking down from a clean uptrend, the JPY is no longer looking like a safe bet for a carry trade.

While I'd say the short term looks like a pullback/consolidation, the slightly longer term is showing significant strains, whether that be apparent in carry trades, Yields, the accumulation and movement in TLT/Treasuries, the safe haven buying of bonds, whether Swiss, German or US, there's a clear flight to safety that has been underway for some time.

As for today's dominant Price/Volume Trend, it depends on the average, the Dow-30 that only lost -0.04% today didn't have a single dominant relationship, but despite the minor losses in the Dow, the components saw two co-dominant P/V relationships, Close Down / Volume Down and Close Up / Volume Down. The first relationship is telling us there's no oversold condition, it's a pretty benign relationship, actually the most benign of the 4 possibilities. However, the second co-dominant P/V relationship is the most bearish of the 4, Close Up / Volume Down and we saw strong closes among the Dow components  in UNH, T, PG, WMT, JPM and XOM; only 2 of the 6 closed up on heavier volume today.

The NASDAQ however which was down -0.77% due to an ugly day in AAPL saw a majority of stocks with the dominant P/V of Close Down / Volume Down which again is the most benign relationship, basically telling us the NDX isn't in an oversold condition.

However the Russell 2k with the worst performance on the day at -1.34% had co-dominance between Close Down / Volume Down and the a stronger relationship of Close Down / Volume Up which is typically taken as an oversold condition, especially 1-day oversold and the next day often closes up when this is the dominant relationship. 

The SPX was down 0.45% and had a Dominant P/V relationship of Close Down / Volume Down, again this is the most benign relationship.

The point being that the averages like the Dow that had the smallest loss of the day actually had the worst P/V relationship, whereas the NDX and SPX which had ugly closes, but in between the Dow's minor loss and the R2K's heavy loss both had very mushy, benign Price/Volume relationships of Close Down / Volume Down as the Dominant relationship in both averages.

The R2K with the worst losses on the day had the most bullish short term dominant P/V relationship of Close Down / Volume Up which suggests at least a 1- day oversold condition exists which most often resolve by closing up the following day.

This fits pretty well with a short term oversold pullback/correction resolving in an upside bounce. However as established some time ago, the more important trend has seen serious damage done to it.

As seen above, the TF/Russell 2000 and NQ/NASDAQ 100 also have the strongest futures charts tonight with the NQ chart having a 5 min positive divergence and the TF chart having a sharp leading positive divergence.

Risk assets such as HYG, JNK and DHY all had a stronger close than the SPX, while other risk assets such as HIO or FCT that are good sentiment indicators, but too small to be of any use in market manipulation show a risk off posture that has been steady since the market moved above the SPX new high. I would fully expect just from those 5 assets alone a short term move to the upside with longer term decay, just as it was described last week before we made the new SPX nominal high, "A market that is akin to a thin, shiny veneer with deep structural rot under it".

So far the $AUD, $USD and EUR/USD support short term market gains, while the EUR/JPY and USD/JPY that are more representative of longer term structural indications support the deeper market damage (I almost said theory, but it's not theory, it's in plain view in a number of assets).

Likewise, intraday movement of short term Yields are supportive of short term gains and closed out the day stronger than the SPX, while the bigger picture in Yields shows an obvious flight to safety and supports a deep negative divergence and deep market downside.

Further indicative of bigger picture structural damage can be found in the worst performing sectors today, they may sound familiar: XME/Metals and Mining (not all that important), the recently strong Home Builders, XHB down -1.70% today; SMH (Semi-Conductors) down -1.56%; the recent out performer, Transports/IYT down -1.46%; OIH (Oil Services) down -1.42%; BioTech/XBI -1.36%; and Regional Banking/KRE down -1,23%.

In most cases we either have recent out performers leading to the downside today even as the Dow barely closed red, such as Home Builders and Transports. We also have pretty solid representation among the crucial sectors (part of the 3 Pillars) with Tech down (SMH), Energy (OIH) and Financials (KRE). 

Also supporting the longer term decay/market down side is the move out of the Seasonal Adjustment period as represented by US Macro-Economic reports having their worst 3-day run in 9 months. This is just about the same time last year we were loading up the truck with shorts as the Seasonal Adjustment period came to an end and Macro-Economic data went from stellar to surprisingly bad in a short period (it was actually always bad, the seasonal adjustment period just masked it and when the seasonal adjustment period ended, the data turned south very quickly).

The price pattern today appears to have been a double bottom (short term) with the second bottom being the head fake or run of stops, it also seems to fit well with the accumulation that would be seen with VWAP.

Typically selling or distribution would be at the top of the VWAP channel and accumulation would be at the bottom, the best fills are at VWAP or under mush like we saw today. With distribution the best fills would be at VWAP or above.

The SPY Arbitrage model also looks supportive for a near term move.

SPY arbitrage model is trading above the SPY.

On the other side of the coin as for long term market structural damage, here are just a few breadth indicators, they are not at all consistent with new highs in the market.

The name of each indicator is at the top left of the chart, the indicator is green the comparison symbol is the SPX in red.


As for short term divergences in the market averages...
 SPY 5 min positive divergence at the double bottom lows.

 DIA 10 min positive divergence at the same area.

 QQQ 2 min leading positive divergence at the second lower low with a higher 3C high.

 IWM 1 min also making a new leading positive high


IWM 5 min also making a new leading positive high.

Finally, AAPL the stock everyone is curious about today.
 AAPL stop run

I didn't even bother to mark the divergences, they should be obvious.
 AAPL 1 min

 AAPL 30 min

 AAPL 2 min

AAPL 15 min

And since I started this post, the NQ/NASDAQ 100 5 min positive divergence has grown even larger.

That's the kind of divergence I never walk away from.