As for futures, earlier today I said in this post, Market Pullback/Consolidation...
"I've just gone through a boatload of charts and while there is serious damage done to the market structure, this appears to be nothing more than a short term consolidation/pullback."
Basically I see today's action as a short term pullback or consolidation before the market heads higher.
Tonight's futures thus far are confirming the earlier post which was followed up with numerous charts showing why I believe what I said above...
Here are the futures thus far tonight...


At the same time the move in the JPY/Yen has been substantial, I imagine some of this is short squeeze, but that would only put more pain on open or remaining carry trades so they'd likely see some more funds moving to close the positions, this paints a bleaker longer term market picture.


While I'd say the short term looks like a pullback/consolidation, the slightly longer term is showing significant strains, whether that be apparent in carry trades, Yields, the accumulation and movement in TLT/Treasuries, the safe haven buying of bonds, whether Swiss, German or US, there's a clear flight to safety that has been underway for some time.
As for today's dominant Price/Volume Trend, it depends on the average, the Dow-30 that only lost -0.04% today didn't have a single dominant relationship, but despite the minor losses in the Dow, the components saw two co-dominant P/V relationships, Close Down / Volume Down and Close Up / Volume Down. The first relationship is telling us there's no oversold condition, it's a pretty benign relationship, actually the most benign of the 4 possibilities. However, the second co-dominant P/V relationship is the most bearish of the 4, Close Up / Volume Down and we saw strong closes among the Dow components in UNH, T, PG, WMT, JPM and XOM; only 2 of the 6 closed up on heavier volume today.
The NASDAQ however which was down -0.77% due to an ugly day in AAPL saw a majority of stocks with the dominant P/V of Close Down / Volume Down which again is the most benign relationship, basically telling us the NDX isn't in an oversold condition.
However the Russell 2k with the worst performance on the day at -1.34% had co-dominance between Close Down / Volume Down and the a stronger relationship of Close Down / Volume Up which is typically taken as an oversold condition, especially 1-day oversold and the next day often closes up when this is the dominant relationship.
The SPX was down 0.45% and had a Dominant P/V relationship of Close Down / Volume Down, again this is the most benign relationship.
The point being that the averages like the Dow that had the smallest loss of the day actually had the worst P/V relationship, whereas the NDX and SPX which had ugly closes, but in between the Dow's minor loss and the R2K's heavy loss both had very mushy, benign Price/Volume relationships of Close Down / Volume Down as the Dominant relationship in both averages.
The R2K with the worst losses on the day had the most bullish short term dominant P/V relationship of Close Down / Volume Up which suggests at least a 1- day oversold condition exists which most often resolve by closing up the following day.
This fits pretty well with a short term oversold pullback/correction resolving in an upside bounce. However as established some time ago, the more important trend has seen serious damage done to it.
As seen above, the TF/Russell 2000 and NQ/NASDAQ 100 also have the strongest futures charts tonight with the NQ chart having a 5 min positive divergence and the TF chart having a sharp leading positive divergence.
Risk assets such as HYG, JNK and DHY all had a stronger close than the SPX, while other risk assets such as HIO or FCT that are good sentiment indicators, but too small to be of any use in market manipulation show a risk off posture that has been steady since the market moved above the SPX new high. I would fully expect just from those 5 assets alone a short term move to the upside with longer term decay, just as it was described last week before we made the new SPX nominal high, "A market that is akin to a thin, shiny veneer with deep structural rot under it".
So far the $AUD, $USD and EUR/USD support short term market gains, while the EUR/JPY and USD/JPY that are more representative of longer term structural indications support the deeper market damage (I almost said theory, but it's not theory, it's in plain view in a number of assets).
Likewise, intraday movement of short term Yields are supportive of short term gains and closed out the day stronger than the SPX, while the bigger picture in Yields shows an obvious flight to safety and supports a deep negative divergence and deep market downside.
Further indicative of bigger picture structural damage can be found in the worst performing sectors today, they may sound familiar: XME/Metals and Mining (not all that important), the recently strong Home Builders, XHB down -1.70% today; SMH (Semi-Conductors) down -1.56%; the recent out performer, Transports/IYT down -1.46%; OIH (Oil Services) down -1.42%; BioTech/XBI -1.36%; and Regional Banking/KRE down -1,23%.
In most cases we either have recent out performers leading to the downside today even as the Dow barely closed red, such as Home Builders and Transports. We also have pretty solid representation among the crucial sectors (part of the 3 Pillars) with Tech down (SMH), Energy (OIH) and Financials (KRE).
Also supporting the longer term decay/market down side is the move out of the Seasonal Adjustment period as represented by US Macro-Economic reports having their worst 3-day run in 9 months. This is just about the same time last year we were loading up the truck with shorts as the Seasonal Adjustment period came to an end and Macro-Economic data went from stellar to surprisingly bad in a short period (it was actually always bad, the seasonal adjustment period just masked it and when the seasonal adjustment period ended, the data turned south very quickly).
The price pattern today appears to have been a double bottom (short term) with the second bottom being the head fake or run of stops, it also seems to fit well with the accumulation that would be seen with VWAP.

The SPY Arbitrage model also looks supportive for a near term move.

On the other side of the coin as for long term market structural damage, here are just a few breadth indicators, they are not at all consistent with new highs in the market.
The name of each indicator is at the top left of the chart, the indicator is green the comparison symbol is the SPX in red.


As for short term divergences in the market averages...


IWM 5 min also making a new leading positive high.
Finally, AAPL the stock everyone is curious about today.
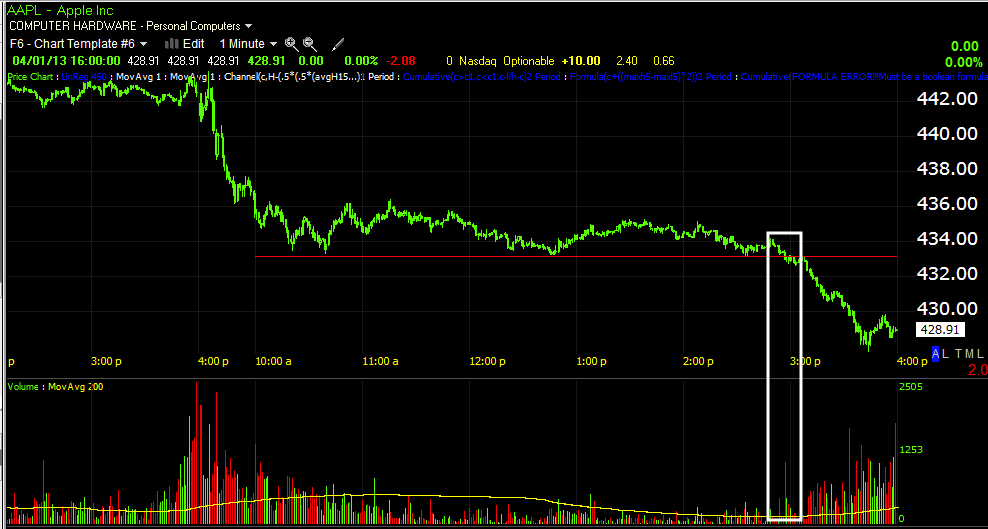
I didn't even bother to mark the divergences, they should be obvious.


And since I started this post, the NQ/NASDAQ 100 5 min positive divergence has grown even larger.


No comments:
Post a Comment