Monday, April 29, 2013

SPX Target-$1597.35 /SPY $159.71

UVXY & FAZ Charts


UVXY-short term VIX futures (leveraged long)
 1 min intraday

2 min leading positive with a nice rounding bottom area.

 Just to show you, this divergence goes out to the 15 min chart in leading positive position, I don't expect a long trade, but perhaps a couple of days.

FAZ 3X Leveraged Short/Bear Financials
 2 min intraday

3 min intraday

Again, leading positive out to the 15 min chart, the last turn down did not see any strong distribution, I'm thinking this could put in an impressive move.

Also Adding to FAZ Long Equity Position

Going to add some UVXY Long Equity Here

This will bring the position to about 2/3rds a full position, but this is still a short term trade.

Currencies


As mentioned earlier, a few seemed to be hung up, here's what I see as of now...

Single Currency Futures...
 Euro 1 min is starting to go negative enough that I think it may move, this was hung up earlier.

 The 5 min Euro chart is leading negative big time, this looks like at least a decent quick move to the downside, this is market negative.

 The $AUD 1 min intraday is in line with the trend...

The 5 min looks like the $AUD will pullback (market negative and fits with a short term pullback and then the market finishing this leg up).

The 15 min $AUD chart seems to confirm the above, short term market/$AUD pullback and then finish this leg higher.

The $USDX 1 min has a nice patch of accumulation, but neear term it's been huing up on an intraday negative divergence.
The 15 min chart is very positive, I expect this will have to do with once the leg up is finished. The 5 min in between has no solid signal.

Pairs...
 EUR/USD 1 min/intraday is starting to go negative here, I'm not really sold on it yet and it may have to do with $USD short term signals not quite being there yet.

 EUR/JPY is starting to go negative here, the Yen has very positive 3C divergences.

USD/JPY 1 min starting to go negative, it wasn't last night, again I think this has more to do with the Yen  than the $USD.

Went with...

SPY May 3rd 160 Put

IWM May 10th 94 Put

both spec size

I think it's now worth it to Play a Weekly Put on the SPY.

I'll let you know what strike and expiration I chose, but probably next week and slightly in the money

Leading Indicators...

Some of these indications were captured as I first posted that the levers were being pulled to get the SPX above that resistance level and create a head fake move and some I went back and grabbed captures after they no longer needed to pull the levers, the break out is self-sustaining as retail buys it, until retail can't hold it anymore.

It will be interesting if we have the time to go back later and see at least how TLT, VXX and HYG acted.

*All Leading Indicators are compared to the SPX in green unless otherwise noted.

 High Yield Credit was not following the SPX on the breakout move-obviously this was captured after, but HY credit is not one of the 3 levers, the 3 levers are High Yield Corporate Credit (HYG), TLT (20+ Year Treasuries) and VXX (Short-term VIX Futures).

I'm not surprised HY credit didn't confirm and instead put in a negative divergence at the break out area or the head fake area I mentioned well over an hour ago.

This is HYG BEFORE the breakout move, it is keeping perfect pace with the SPX.

 Here's the slightly longer view where you can see HYG is higher than the SPX at roughly the same relative area (at the two highs seen above).

 This is an HYG capture after the breakout, HYG is no longer following the SPX, it fails to make a higher high; it is still negatively dislocated with the SPX, but not leading yet.

This is HYG intraday 3C seems to be keeping up, buy HYG is struggling, it's already at a negative divergence with Friday's trade.

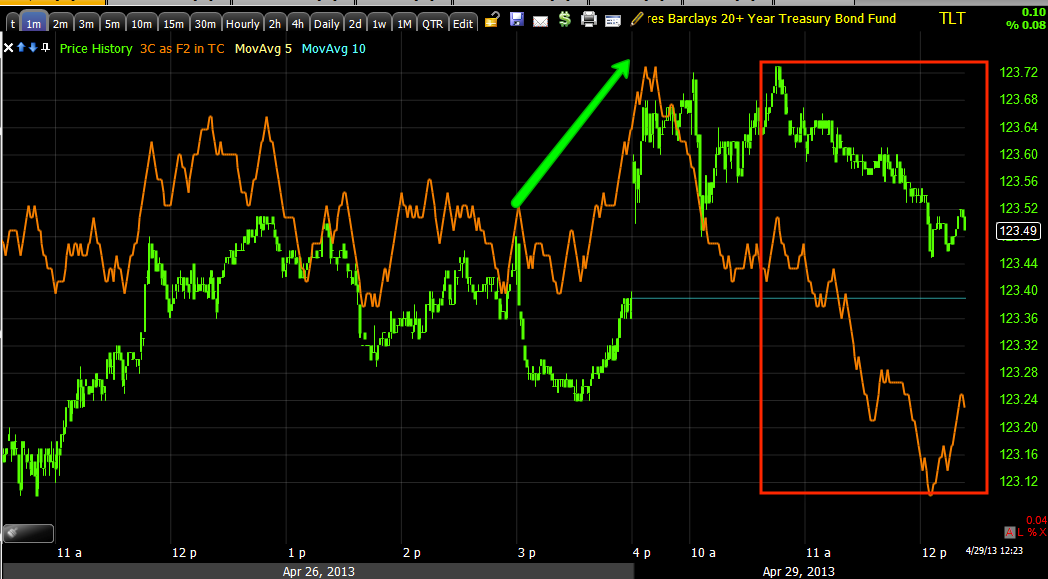
TLT seems to be the main lever and it is one of the 3, this was the first I saw negatively diverging BEFORE the breakout, this is when I posted the "Levers" post and showed you the SPY arbitrage improvement.

 Note how TLT gapped up this morning WITH 3C confirmation of the move, then saw a negative divergence on an intraday chart to push it lower, thereby effecting the SPY arbitrage value.

 You can see the same in Yields, they were moving negative and around the same time as the other levers were pulled, Yields started rising, helping the market BEFORE the breakout. Yields ARE NOT confirming the SPX move, although I wouldn't expect them to.

 VXX is one that is holding up better than it should be, it's the same phenomena we saw just before the last 2.3% 1-day correction in the SPX, it was seen in TLT also and we saw the same late last week.

VXX is seeing a positive divergence as you might expect in to lower prices here after the SPX move.

 The $AUD is broadly supportive of the market as can be seen between the two relative price (SPX) highs.

Intraday though it goes flat at the SPX breakout and has not been supportive since then, actually declining since.

 Euro is also broadly supportive, this is one reason I think the pullback/consolidation will be short lived to finish up the upside move, then these should all start negatively diverging with the SPX. The fact they hadn't is why I'm not so hot on playing a downside move.... yet

 The Euro intraday was supportive until the breakout, now it is negatively diverging.

 The Yen became supportive as it moved down, although I doubt this is part of any manipulation.

I'm going to check currencies because as I said before, they were the asset class that was hung up earlier.


Just as I posted the last update...

Exactly what I said, I noticed it first in the NYSE TICK Index (1 min)...
 NYSE 1 min TICK shows an obvious move in the market, IO checked the SPY next...

Here's the intraday trendline I showed in the last post and there's the head fake move.

Levers Are Being Pulled

I'm working on the Leading Indicators post and as soon as I saw the first few indications, I immediately check the SPY arbitrage to see if it was improving as it looked like some levers were being pulled from the Leading Indicators layout, no surprise...

It's not quite positive, but it is 30 minutes delayed, but it is moving up and at this point, only a $.05 negative differential, as I suspected, this is why prices are sitting where they are with these negative divergences.

I still think it has something to do with this...

At least 80% of reversals pull a head fake move first and in this case, that's the SPY moving above $159.27, we already know it will be a head fake move from the depth of the leading negative divergences, but these failed breakouts create strong momentum for a reversal and the fact that they are now using levers tells me they haven't been able to make the $.12 cent move and need the extra help of short term intraday manipulation, most is coming from Treasuries-TLT.