Wednesday, July 10, 2013

Market Update

In last night's "Daily Wrap" I showed you the Dow-30, the NDX-100, the SPX-500 and how close they were to a very obvious range, I think the SPX was 1 PENNY from breaking above that range where limit orders would be stacked up most likely, the Dow wasn't far at all, the NASDAQ wasn't far, but had the furthest to go.

" In the SP-500's case, resistance at the arrow to the left is at $1654.19, today's HIGH was $1654.18, EXACTLY 1 PENNY AWAY FROM A TECHNICAL BREAKOUT.

What market maker or specialist wouldn't push for that, it's worth it just for the volume rebates or the spread."

There's also a zone of overhead resistance in that area that gets a lot more sticky for the market considering all the gains have come from overnight, low volume futures, during the day the market hasn't been able to do much so I was kind of expecting those levels would be hit and the easiest way would be to move the market to gap up through the overnight futures, that obviously didn't happen.

We still have quite a bit of time today as far as "Things that can happen" and I don't mean just one. I also showed you in the last post (VIX Futures) the very flat range in VXX, UVXY and XIV, I'd say 80% of the time before a reversal there's some kind of head fake move, for VXX and UVXY it would be a run on stops below the range, for XIV a false breakout of the range, but they are just that common.

In any case when I first looked at the market update I put together the SPY looked a lot more like it would try to hit that range I talked about last night and above, it doesn't look as great now, but things change fast. I want to show you the short, intraday 1 min or so and what's right behind it in the context of any head fake moves on an intraday basis either at the ranges I talked about last night or even the ones mentioned in the VIX Futures post.

 This is the weakest chart, but also the fastest to move so we use it for intraday moves, it's the 1 min IWM, it looks here like there's some strengthening and possibly the IWM moves up intraday, that doesn't mean that's where it ends today...like I said, we are very close to these ranges and we still have a lot of time in the day as far as moves are concerned.

 The very next chart , IWM 2 min shows no strength at all, so the point being, any short term move would almost absolutely be that as there's no strength behind it even at the next timeframe of 2 min., it's actually quite weak, which makes sense when looking at the VXX/UVXY charts or a number of other assets/charts and indicators.

 The QQQ 1 min has made more of a move, but as I said, it had the furthest to go, but it looks like its seeing distribution in to this move and the TICK chart at the end is also interesting in the context of this particular chart.

 QQQ 3 min is obviously not showing any strength to support any kind of move that is much more than an intraday move and I think at this point they'd need to pull the levers of Arbitrage (HYG, VXX and TLT). HYG is already up a bit , although seeing distribution, a head fake move in VXX would accomplish the same as far as pulling the arbitrage lever and TLT has pulled back today which is another subject entirely as a trade. The point being, even a very quick head fake move that would normally be seen with such a tight / Flat range like VXX's would also accomplish pulling the SPY arbitrage lever.

Now I didn't even look until I typed that last sentence, but take a look at the SPY Arbitrage model I just captured.
They are pulling the lever because the market isn't strong enough to do it on its own, it was that obvious that when I checked this chart, it was exactly what I thought would happen, except already well under way.

 This is the SPY 2 min intraday, it's not strong, that's not a positive divergence, but it's improvement to try and help out here.

The very next timeframe (the concept of migration of a divergence) there's nothing positive or even helpful, in fact the leading negative has only added more downside to the divergence today, so once again, very weak here.

And the TICK chart which has been weak all week, barely able to pass +100, has been in a tight, flat range of -750 to +600, this is exceptionally week or a standstill, very few stocks are moving up vs down, in fact the bias is toward more moving down with the -750 lower range.

Just something to watch for because I think if it gets pulled off as I thought yesterday, that will be an excellent entry place for assets like VXX, FAZ, etc.


Short Term VIX Futures....

I've talked about and illustrated this 3C concept before, but this is another chance to show you a good example of it and we'll come back and take a look and have an "After action report".

First VXX and UVXY (the VIX short term futures), these move opposite the market, UVXY has 2x leverage.

 VXX 3 min, the negative and then leading negative divergence at the top at the same price area is a somewhat interesting event, just showing the difference between price at the exact same level but the second time there had been significantly more distribution.

There are two areas of positive divergence here, this is a concept that is a bit more rare and we don't get to see that often, but in just about every case over years of using 3C, wherever the first divergence starts, price almost always significantly passes that area which I marked roughly with a green hash mark by price of where the first started. The reason this is interesting is because it takes institutional money a while to put together a position, if it's a large position for a large bull market trend, it can take up to a year. The point is in this case the with accumulation continuing in to lower prices (the same as they sell in to higher prices) there's an average position cost somewhere in the middle, typically as we see stronger divergences toward the end I'd presume most of the position is at the lower cost, but in my experience even though they wouldn't need to pass the area where the divergence first started to have a profitable trade, they almost always do and usually by a pretty significant margin.

 5 min UVXY shows the same two areas, also notice how flat the range of the last two days has been despite price and the fact VIX futures trade nearly mirror opposite market averages' price.

The flat range also opens up the higher probability of a head fake move right before a reversal, however I'm not sure that this behavior is as prominent in something like VIX futures vs a stock controlled by 1 market maker or specialist. In any case the other concept would be that distribution and accumulation are most often seen or at their strongest at these flat areas, this is why I always say, "Quiet markets are like the kids in the room next door being a little too quiet, you know they are up to something" and a flat range like that is about as quiet as you get.


VXX 15 min also shows the two same areas at the exact same place/level with a stronger leading positive now.

XIV is the opposite of VXX, it trades with the market, for confirmation VXX and UVXY should have the same signals and XIV should be the opposite signals.

This 5 min chart is clearly opposite, it also features the very flat range seen as underlying trade is prominent.

XIV 10 min is pretty much the mirror opposite with the start of the move being almost exactly the same , but mirror opposite, the same price level 2x with a stronger leading positive at the second test of the low.

We also see the same two negative divegrences like VXX has the two positives, I didn't look at the exact date, but I'd bet they are the same date.

XIV 15 min leading negative and much stronger on  a long term timeframe that usually takes some time to move, it is quite a move in a short period and right where price is in a tight/flat range.

Obviously I like VXX and UVXY long and as I said, they trade opposite the market.

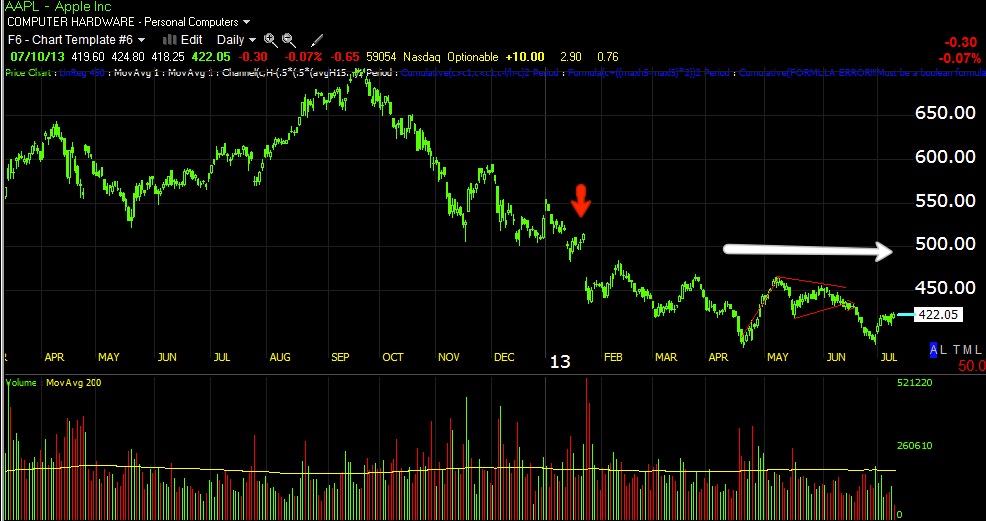
AAPL Update

What to do with AAPL, Short? No, Long. You may recall how long we watched a process in AAPL and knew something was going on, right now the AAPL equity long is at a 6% gain, that's nearly catching it right at the bottom. I chose AAPL equity long (although we did have some option trades when it first moved) for a reason, I believe AAPL is going for a bear market rally or counter trend rally, there's no doubt after being down 45%, AAPL is in a bear market.

In any case, the non-leveraged position was chosen to be able to ride out a choppy trend that should see a nice, sharp rally as we have seen begin, I love bear market rallies. I do not think this is AAPL regaining its former glory, but a good bear market rally is a strong move so for now based on the charts which were beautiful, I'm sticking with it as this was the original plan, the expectation that there would be chop and draw down.

 If I were in an options trade (call), I'd feel differently, but this is why I didn't chose leverage for this position.

2 min chart

3 min chart- These don't look horrible, but AAPL looked really nice so it's a step down from where it was.

This 10 min chart is probably the most significant in the near term to keep an eye on, I have no illusions that AAPL will pullback during a market leg down, this 10 min chart can give us an idea of how much, right now it's just like a thread hanging out of a sweater, but things can move quickly.

Longer term charts and really what the position is based on look fine, like this 15 min leading positive.

You can go back and look at the psychological process of creating volume or supply and how and where it was accumulated, it's actually interesting, out entry was darn close to perfect, about 1% or so off from the bottom. The point being is this 2 hour chart shows the longer term potential and I think AAPL will end up quite a bit above the large triangle.

This is the trend in AAPL, from a 45% loss to a small capitulation moment and a basing process, again this base is no where near big enough for AAPL to reclaim its former glory, but to see a sharp counter trend , bear market rally, it's just the right size. I'll stick with AAPL.

FAZ Update

FAZ (3x short Financials) was one of the ETFs that really shaped up late yesterday, it's made a run this a.m., but it looks like it will pullback, I'm going to set some price alerts for that pullback.

Typically I might be looking more at an XLF put, but in situations where I think there's a better chance of a trending position or a position that has some legs rather than a quick pop, I prefer to use less leverage, there's SKF as well which is 2x leveraged bear financials.

Here are the charts and the XLF 1 min chart seems to confirm the idea of a pullback in FAZ.

 FAZ intraday very strong the last several days and especially yesterday, the small intraday negative looks like a pullback is probable so I'll be setting alerts for that.


 Migration is obviously apparent on the 2 min chart, the move under the yellow trendline looks like a stop run both from volume and the strength of the 3C signals in the area.

 Again migration of the divergence is what we want to see in a stronger, healthier divergence and this is leading beautifully.

 The 5 min chart

The 10 min chart.

I'm going to try to look specifically through the Financial Industry group and banking/investment banking sub-sector.

Closing last week's SLV $19 Calls

Quick Market Update

The SPX and Dow have this more traditional look and it looks right, there's a lot more to look at as a.m. trade burns off, but here's a basic example using the SPY.

 Yesterday we had a late day "in line" reading that was an improvement from earlier in the day, it's very early in the day of course, but there's been some damage done there.

The progression through charts looks right, the process of the reversal to the upside to the left looks proportionate to the move and to the process on the top side (which isn't well drawn) as the bottom reversals tend to be a bit tighter than the top reversals, but the other thing that stands out is the 3C chart looking worse and worse and now down to the area where the upside reversal started.

The 3 min chart's progression looks just about perfect considering where price is and the shape, the series of charts above looks more like a textbook 3C reversal than any I've seen in a while.


MCP Update

For the kind of position MCP was intended to be, I still love it and am holding it long. This was never meant to be a trading position, this was meant to be a stock that could walk on its own two legs, a stock that went through the cycles and is near the end of a stage 1 base with stage 2 mark-up next. I'm a bit surprised to see it up today, but it looks like it is coming along well. Sometimes these lower priced stocks act more like the market should.

 On this 5-day chart you can see the end of stage 2 at the far left transitioning in to stage 3 (top) and of course stage 4 (decline) and back in to stage 1 (base) preparing to move to stage 2 (mark-up) where the easy money / trending trades are found. Most stocks go through this cycle and in every timeframe.

The change in character in MCP is very clear just looking at the price chart, this is why I like to start with longer term (5-day) charts, trends and character are clear.

On a 1-day MCP has been vacillating as part of the normal basing process, the least move was on volume, the gap was filled so it looks solid, today so far we are above resistance (too early to judge volume), but again it's not about a 1-day or 1 month move here, this is a great looking stock toward the end of a nice base.

 For now until it really starts to trend I'm just using the 1-day X-Over screen, you can see we are just shy of all 3 signals firing a long signal, just the custom indicator in the middle window needs to cross its moving average (blue), everything else is a go.

This is the daily chart, from distribution at stage 3 which is what stage 3 is, distribution/top, to a leading positive 1-day divergence which is impressive, we don't get to see too many of these anymore, at least not right now.

The 4 hour chart is perfectly in line and doing what it should be, with this leading positive divergence now, MCP "may" be getting ready to move to stage 2, you can see there wasn't the same leading positive on the last run which was just knocked down so MCP could be accumulated at lower prices.

I'm staying patient with this one and think it is probably going to be a big winner with very little maintenance.

IYT Put Update

This was the transports put from yesterday, it's already at a decent gain, but I'm expecting a little bounce, but behind that there's not much so I'll be holding.

 1 min for an intraday bounce

2 min has nothing positive.

Just like yesterday, the DJ-20 transports look EXACTLY the same.

MCP Longs Wake Up- You have a 5% move Right now

Pre-Market Futures

If you've looked at the Russell 2000 futures overnight then you know it was one of the rougher, choppier sessions and it looks to gap down across the board. The 1 min 3C charts aren't trending so they don't tell us much, but the longer charts are and they, especially 5 min charts look pretty bad as I showed you on the release of Chinese data, with the Shanghai Composite being saved from a red close by a PBoC rumor.

In other futures, perhaps the night was choppy because the AUD did in fact fall.

AUD overnight

I still would expect the gap to be filled and those limit orders at least to be hit, but we'll see around 10:30 when the charts start catching up top the averages.