Friday, July 12, 2013

Market Sentiment

Pretty simple...

"Bullish Sentiment on StockTwits is at its highest level in 2 months and now sits at 55% "

Intraday Charts

This looks to be FX oriented, it may be pin oriented too. The 3 min damage is done, it has migrated and that is what I was looking for, this seems to be intraday, it may set something up, I'll be looking, but still looking for a stronger edge.

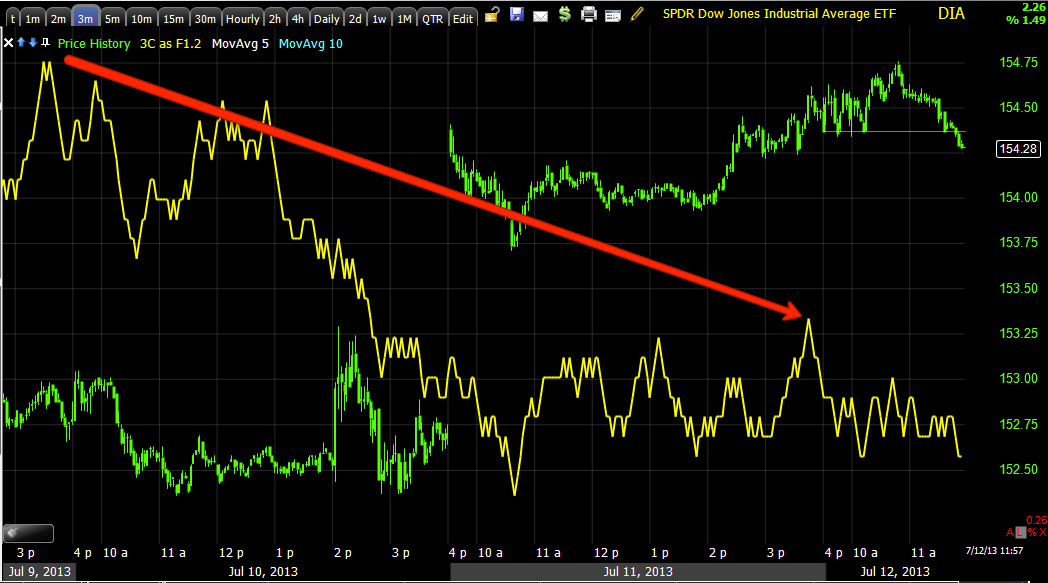
 This is the DIA intraday 3 min damage I was talking about.

DIA 1 min looks like its going to bounce

IWM 2 min is the damage I was alluding to taking place, but as far as a bounce...

IWM 1 min looks also like it's going to bounce intraday

QQQ 3 min, again the longer intraday trends are moving like I've been waiting for.

But short term it looks like a bounce is coming intraday.

SPY 3 min has seen damage intraday

Again the 1 min looks ready to bounce.

This may be the cause...
AUD/JPY 1 min

Intraday Update

I'm still not ready to commit to anything yet although there's been a lot of near term improvement.

I was just looking at the AUD/JPY and 3C looks like an intraday bounce, I checked the averages and the same, intraday bounce. I wanted to get this out quickly, but I'll post charts.

Credit is seeing Distribution

This has been more of a short term (Lever), but one I've been watching for, HYG intraday distribution.

Yesterday and the day before I mentioned JUNK credit was already seeing this distribution, Junk credit trades almost exactly like HYG, but since it's not an arbitrage asset, it sometimes has a more accurate signal.

Now HYG is following the lead that was apparent in JNK a couple of days ago.

I'll take a look at Leading Indicators in a moment, but it looks like all of the short term timeframes I have been waiting for before entering anything too serious are now starting to come together pretty quickly this morning.

 HYG 1 min saw strong distribution as a lot of other assets at the same area this morning

HYG 2 min

HYG 3 min at the same location this morning.

HYG 10 min is a bigger and much more important timeframe.

Here's JNK
This started earlier- 2 min

JNK 3 min leading negative divegrence

JNK 10 min.

This is a significant signal

Market Update

I said yesterday I was waiting for the short term charts to come in line, they are starting to surprisingly on a Friday (Op-ex). I already showed you the Q's, I figured that was more AAPL related, but apparently not.

 DIA 1 min has been one of the worst performing the last couple of days as far as underlying trade.

DIA 2 min as we saw yesterday

DIA 3 min

Now finally the 5 min intraday is seeing migration


 SPY 1 min

SPY 2 min

SPY 3 min

SPY 5 min

QQQ Feeling AAPL

 QQQ 2 min

QQQ 1 min

QQQ 3 min- these all have decent migration now.

Now the 5 min chart is moving down intraday.


AAPL UPDATE

I STILL LOVE AAPL LONGER TERM, BUT THE SHORT TERM WEAKNESS HAS BEEN CREEPING IN THE LAST COUPLE OF DAYS, HERE'S AN UPDATE AFTER AN ALERT JUST WENT OFF. (Sorry about the caps)

 AAPL 1 min.

AAPL 2 min.

There's migration of the divergence, I'm not saying this is "it" for the short term trend, but if you are playing this as a short term position, I'd at least have a trailing stop in at this point.

If the migration gets worse I'll let you know and there may be an opportunity for a short term leveraged trade.


Financials

I really don't get how banks have been able to get away with posting loan loss reserves (releasing them for earnings only and then back they go to loan loss reserves), specifically JPM this morning, but nearly every bank that has reported over the last few years has made tight earnings by releasing loan loss reserves.

JPM released $950 mn from loan losses, $550 min from credit losses, $600 mn from litigation reserves for $1.4 billion in "revenue" added to Q2, that's about $.33 EPS for Q2 just in released reserves, you have to look a little past the headline number or news.

Additionally their trading operations fell off badly, net margin interest was the lowest ever and mortgage production was significantly down.

On a separate note UPS (as I think of UPS and FDX to be the new "Transports"as far as Dow Theory is concerned as we have shifted from an industrial to a services economy ) has gone ahead and guided lower, significantly lower this morning.

As for Financials and JPM, it is early, but there are some indications in place already from previous days.

XLF-Financial Sector
 This is early non-confirmation of price off the open in the group as a whole.

This is the 5 min chart and one of the indications I said was already in place, leading negative, which has migrated to the 10 min chart.

10 min Chart of XLF.

JPM hasn't confirmed yet, it is close, but no dice an hour in to the day so this will be an interesting one to watch.

Note JPM's 10 min divergence looks just like XLF's.

WFC had a positive/accumulation (1 min) yesterday early, but it too failed to confirm.

FAZ already has the longer charts in place, it's simply in need of the intraday or "timing" charts to jump in line.

Volatility UVXY / VXX & More

Yesterday what I wanted to see before taking on any "amount" of positions was the 1-3 min charts clear up, the 5 and up were already in a good place, it looked to have started in the late afternoon and seems to be continuing this morning so far (as early as it is, but it's more of a shift in momentum or change in character that is important when it comes to looking for those charts to shape up (mostly for timing). I'm still holding the recent UVXY call position.

UVXY 1 min leading positive
 It's early to be looking at these charts, but the point is the start of the movement around 2:30 is consistent and looks to be the change in short term character (timing) I've been looking for with several positions mentioned, but not yet entered, although I have an open UVXY position and have no problem sticking with it, it's the big picture that I laid out last night that I'm interested in, not a reversal/correction.

 VXX 2 min at the same time yesterday-leading positive

VXX 3 min leading positive

 VXX 5 min- as I said, the more important charts were already there...

UVXY 15 min

The point of last night's post was to point out the bigger picture and the very sudden shift in sentiment among 3C charts from really bad to a lot worse, the carry being the most noticeable "Panic-like" change..
 At this point the ES charts have grown so bad and migrated so much that the former 30 min in line chart around last week is leading negative. This is the bigger picture and suggests a lot more than a corrective pullback.

Even though they re-calibrated CONTEXT yesterday based on the closure of a carry trade and it started at zero and made it to -5, it's now back in the -25 area again that fast.

Yes, it's the bigger picture and the continuity of the charts that gives me the confidence to open the positions opened the last few days.

Pre-Market

There's not a whole lot going on in futures that looks too interesting.

The AUD/JPY pair did slip pretty badly overnight, but looks to be about bottomed just in time for the open.

 AUD/JPY looks like it has hit a short term bottom from overnight, this has been the risk driver for quite some time as you saw last night.

I don't know how banks like JPM get away with calling $.33 EPS or $1.4bn in loan loss reserves as part of their earnings and come in either in line or a beat, bank earnings are ridiculous and it looks like ES thinks the same as it started slipping from some mild earlier morning gains right about the time JPM reported.

ES 1 min going in to pre-market.

As for the rest, I'm sure things will liven up in a minute.

Today is typically a pin day, even with weeklies, I know, but low volume markets.

Typically around 2:30-3 the market moves out of the pin as most option contracts will have expired worthless.