Wednesday, August 14, 2013

XLF Charts (Financials)

There are some intraday 1 min charts that aren't in line or where I'd expect them, it's the same way in the averages at last check, but with the odd morning/afternoon signals and price movement, it has been fairly typical for the intraday low to be accumulated and then sold in to the afternoon, if we are going to get a bounce, I'd say the difference would be that the intraday low is still accumulated, we just don't see the afternoon negative signals.

First I'm going to give you the big picture perspective so you can sort of put a "bounce" in context next to the big picture and draw your own conclusions regarding risk on ANY long positions/Calls (in my view the risk is extremely elevated and the market becomes less and less predictable with increasing volatility).


 The daily chart, like many other averages yesterday, did put in a bullish reversal closing candlestick with a hammer here, not perfect, but good enough to be valid.

I can't say what kind of top may be forming or in place in XLF, but it looks like a right angle broadening top which is what ALL H&S tops start out as, not all become H&S, some stay as broadening tops.

The important thing no matter what kind of top it is, would be my custom cumulative volume indicator I added in blue over price.

In a H&S top it is critical that the left side of the head (the rally side) see decreasing volume on that move as we have here.

*** VOLUME ANALYSIS IS WHERE MOST TRADERS GO WRONG IN TRYING TO IDENTIFY AN H&S TOP AS THEY GO BY PRICE PATTERNS ALONE AND VOLUME IS ESSENTIAL TO IDENTIFICATION.

 This is the De-Mark-ish Custom Indicator on a long term Monthly basis, which provides much less noise and a much stronger signal. The 2007 top had a cluster of sell signals just as the market has seen a recent cluster of Hindenburg Omens, which give a stronger signal in clusters.

The green buy signals came at the 2009 lows and for the first time since then we have the first sell signal right now.

The green arrow is simply pointing out a buy signal in 2008 that led to a month long rally which is not easily evident on this chart.

The daily 3C chart with the 2007 top/distribution, clear 2009 lows accumulation and strong recent 2013 distribution.

This distribution signal through 2013 may seem long, but this is an extreme market, we already know that market breadth fell apart horribly through all of 2013 and that only happens with prices falling apart and crossing below their respective 40 and 200 bar moving averages.

We also know that several large private equity firms have been selling "Everything not nailed down" for 15 months. So the length of the signal which is abnormally long, in my view is not an error, but rather a hint as to how bad the distribution has been and therefore how bad the proceeding market decline will likely be (which is now at historic 100 year extremes in many cases of historic top studies I have done and posted here.).

 The 4 hour chart  is clearly where we'd like to see it as far as the bigger picture goes.

As is the 30 min chart which I include to mark a delineation between 15 min and 30 min charts.

Now coming at Financials from the short end out...
 This shows the afternoon negative divergences and early price action to the downside which is typically accumulated at the intraday lows as can be seen yesterday.

This chart doesn't look right to me for timing an intraday entry, but neither do the market averages at last look, I will look again before I decide whether to enter any positions.


 The 2 min chart is showing the first significant accumulation since the pullback we were looking for last week,

The 5 min chart also shows a significant positive divergence and what will be interpreted by many technical traders as a bull flag in yellow.

 The 10 min chart's overall trend from distribution to accumulation makes Financials look like they are ready to go.

Finally the 15 min chart, please compare to the 30 min chart as the 15 min is no where near as positive as the 10 min so it's almost a transition point, the 30 min is clearly negative and a much more powerful signal.

Opening Speculative GDX Sept. $30 Put / DUST Long

I view this as more speculative than a normal spec. position so I'll treat it that way as far as position sizing and risk management, if I see added signals that really make this irresistible, I can add to the position.

As of now, the 5 min charts that were in line and what I was waiting on have moved in the direction I was hoping.

If you like the idea, but don't want to use the leverage of options and all the other stuff that comes along with them, DUST long would be another way to play this.

 GDX 5 min has gone negative.

NUGT 5 min has seen the 5 min go negative as well

DUST 5 min has gone positive, this is what I was looking for.

There is a slight intraday range so if you really wanted to put some extra conditions on this you could look for a break below (DUST) or above (GDX/NUGT) the intraday range and wait for prices to move back below that intraday high - preferably on some volume.

This would be a better entry for DUST long as options may lose some of the pricing edge in a scenario like that.

Looking at XLF (Financials ) September $20 Call

*I'm putting this out w/o charts for the moment so you can take a look for yourself as I capture, notate and upload the charts/post.

I mentioned last night that last week I was looking for a pullback (slight) and then a bounce; I'm using the term loosely because at this stage of the market and volatility, I wouldn't want a term like "Bounce" to imply a small 1-day or less, almost negligible move.

Market Pullback since last week (SPY)


If we consider the "Big Picture" which I'm using very literally and not implying that it is the ultimate move, but off in some undefined future, then the reality is that any bounce does become much more negligible next to the bigger picture. When the bigger picture is building or already clear, but off in some undefined time period, these "bounces" or rallies or whatever you want to call them, have more importance because they are a way of creating income that can offset drawdown and as we have been using them with leverage, they can not only hedge strong core shorts, but they can add income as well as allowing us to enter strong shorts at the most favorable area (which doesn't always mean the best market timing - right now our core shorts in DE and IBM are excellent examples as having had very favorable entries several months back or more, but are not timed well to an overall market decline.)

The point being, as I have said since last week, "I wouldn't blame anyone who would rather not play a bounce (as it has much more risk now), but rather wait for a bounce to enter core shorts on some price strength". 

In essence the difference now being the utility of bounces previously was to give us good entries and short exposure as this market is one of, if not the most extreme markets I have seen in terms of distribution. We already know several private equity firms have been selling every long asset they have for 15 months now, that implies a significant move to the downside that goes far beyond the media's -20% mark. Also in the past bounces allowed hedging of core shorts as well as extra income as the drawdown on an equity (non-leveraged position) is no where near the gain of a call or leveraged ETF.

Now however, in my view, a bounce is most valuable as a means to effecting an end, which is to use price strength to sell short in to, this is what I believe we have been seeing in the afternoon on market recoveries from morning intraday lows.

I'll get some charts of XLF up ASAP, but it looks like a good, overall sector to play a bounce and I believe that we have gone through the short pullback and are now at the area where a bounce is kind of now or never as some really nice shorts are already falling apart significantly.


Gold Miners: GDX, NUGT, DUST

Gold miners are off on a parabolic move this morning, I don't trust parabolic moves, I've seen too many of them end with the same volatility in which they began and it doesn't matter if they started on the upside or down.

I believe there's at least a put or a dust long that is maturing right now, I'll show you on GDX and then use NUGT (3x long gold miners) and DUST (3x short gold miners) as confirmation. *This post is NOT inclusive of Junior Miners (GDXJ).

GDX
 the intraday charts are negative like this 1 min in to the move.

The 2 min is showing migration of the divergence which gives the divergence more credibility and shows it growing more serious.

The 3 min chart is intraday and leading negative, it looks pretty clear that this run in miners has been seeing distribution.

There's now the matter of the proportionality of the reversal process which I'd say is pretty close for a parabolic move and there is the 5 min chart which would probably be my standard to open a put position or a leveraged short position like DUST long.

The GDX 5 min chart on an intraday basis is in line, this is what I'd like to see turn negative.


 The longer term 10 min chart is already negative so it almost looks like this parabolic move is a head fake move. Note also the clear delineation between the 4 stages starting from left to right, 4) Decline, 1) Accumulation/base 2) Mark-up 3) Distribution.

NUGT (Gold miners 3x leveraged long)
 The 1 min NUGT chart confirms GDX perfectly.

As does the 2 and 3 min above.

And the 5 min is in line just like GDX.

The longer term 10 min looks just like GDX with the 4 stages of a cycle.

DUST (3x leveraged short Gold miners) *For confirmation this should look nearly the mirror opposite of GDX and NUGT.

The 1 min chart leading positive confirms

The 3 min chart leading positive confirms

The 5 min chart in line confirms PERFECTLY.

This one is on my radar for a potential trade if we can get that 5 min to turn negative.

FSLR Update

Yesterday's FSLR Sept. $38 Call position opened  on what looks to have good evidence as a head fake move is in the green right now and looks like it's sitting at some intraday resistance, getting ready for a breakout move. *I do think FSLR is a decent long equity position as well, although speculative.

 This was the suspected head fake move as support was so well defined, it's pretty easy to guess where stops/limits would be congregated.

This is a 2 min chart mostly from yesterday, the price pattern suggests the reversal process is proportionate with the preceding move and the 3C chart clearly suggests accumulation on the move lower which is what we look for to give us probabilities of a head fake move vs. a real break.

Right now FSLR is sitting right below the break (former support, now resistance) with a nearly 2% gain, I think it's not long before it breaks out, the accumulation on the head fake move yesterday was too convincing, thus the call position entered.

Often intraday/day traders will use this 50-bar 5 min chart to exit/enter positions, the Trend Channel will likely be used as an initial momentum gauge as I'm more interested in capturing initial momentum than highest price with options, unless there's good evidence suggesting there won't be too long of a draw down or consolidation period.

Also the momentum indicators have flipped to positive.

URRE Add-to Long Equity Up over 7%

This was an established long equity position from last week, yesterday I decided to add to it.

While the major averages are all down, URRE is up +7% today at last check.
Yesterday's positive that looked like URRE was ready to launch.

I'll be holding this one for a longer term move, that's the plan any way

VIX Futures Seeing Some Changes

Intraday VXX has been pretty close to perfectly correlated in price vs the SPX (an inverse or opposite correlation), the longer term VXX (which starts at 5 min) is still very positive so nothing has changed there, but what is interesting is the short term changes just recently, starting yesterday and moving in to today (I pointed out actual VIX Futures positive divergences last night).

 Notice the change in VXX underlying trade while the price correlation is still pretty close to perfect with the SPX?

That's 1 min, for more confirmation...

2 min

3 min, so there's an obvious change here that just got underway yesterday and has shown itself to be a trend starting by carrying through today.

The VXX 5 min chart (longer term) hasn't changed at all, it's still leading positive and very suggestive of a lot of protection being bid which is fear of a market crash or at least severe downdraft...

Also remember the signals in spot VIX as well as the Bollinger Bands posted last night.

For confirmation (I'm not including every time frames)...

UVXY, a leveraged version of VXX managed by a totally different group and...

XIV which is the inverse of VXX and managed by a thrid different group. In other words, these confirming signals wouldn't be there if there wasn't something going on.

This is the 5 min VIX futures posted last night

As I said yesterday, if it weren't for a chart or two in each of the averages still suggesting a bounce, I'd be VERY hard pressed to argue for one.

 HYG 15 min positive

SPY 10 min positive.

There is at least one in the 5 to 10 min range for each of the major averages, not so much in the Index futures.

Something is changing here quickly.

Opening Indications

Nothing new under the sun again for the last week. The same negative divergences in to afternoon strength/recovery that have been just about every single day for the last week (plus) were there again yesterday as I reported yesterday and again in the Daily Wrap and the market is moving on them as usual.

 DIA's 3C weakness yesterday afternoon.

IWM's 3C weakness yesterday afternoon'

The Q's were especially interesting after Icahn's tweet

And the SPY's.

I've hear numerous reasons from Carry trades to rotation to Europe before their close, but the fact is these signals have been there and we have been predicting early weakness for over a week now so this is something that's already in place and isn't a spontaneous switch or change in the market.

 My gut feeling is this steady trend is distribution of ANY price strength by various funds.

USO Update

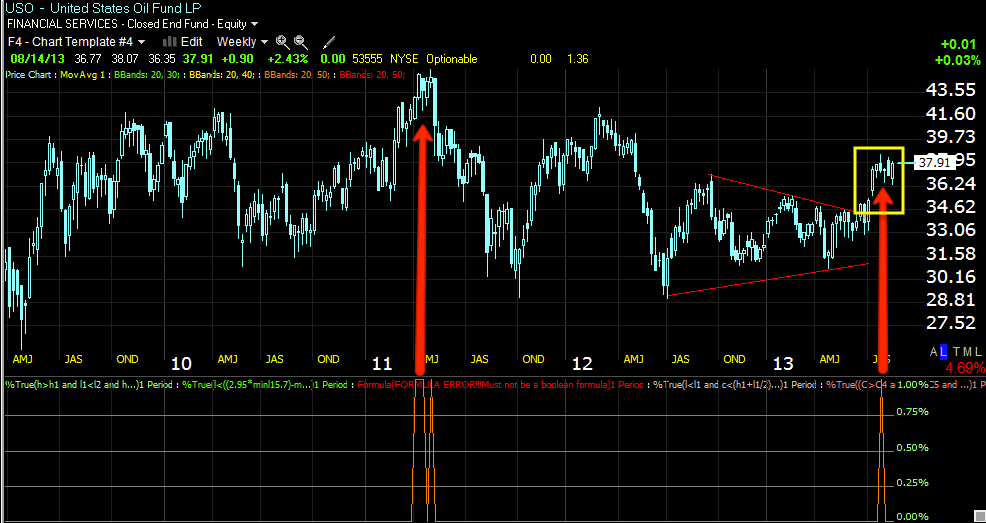
I mentioned USO/oil as a short candidate last night, there are a couple more charts I'd really like to see fall in line before it really looks great, but with the typical a.m. trade period and the 10:30 EIA Petroleum Status/Report coming out this morning, I figured I'd use this time to show you a few things.

 Daily USO, I'm just pointing out Reversal Candlesticks with higher volume and their tendency to be more reliable reversals, a candlestick reversal does not imply a target, it could be a 1-day reversal or something much bigger, the only way I find they imply any target or sense of importance is the timeframe chart they are found on like 1 day vs a weekly chart.

The recent run has seen the real bodies of each candle diminish in size which is a sign of a loss of momentum / health.

 The weekly chart shows a very clear and dramatic drop off in volume through 2013, really this has been going on since 2011.

The yellow resistance zone does look like a tempting stop / limit run on a head fake move so that's one thing that's held me back a bit.

Some weekly sell signals with the last one coming out of a symmetrical triangle that really had no bullish/bearish bias as the preceding trend was a large lateral choppy range.

 The 60 min chart shows the start of the cycle with accumulation to the left and a mark up period in green and now a leading negative divergence.

 The 15 min chart with a small accumulation area and recent distribution- however there are a few timeframes in between these that need to be filled in before I'd feel very comfortable with a new position.

Intraday 2 min USO

3 min USO

This is Crude (Brent) 5 min chart.

I think USO is worth paying attention for a position soon.

Pre-Market

Just as "Blah" as last night. July PPI moved ES a bit, but overall, flat to down a bit as we closed yesterday out at 1692 and are currently at 1689.

About the most exciting thing left in terms of data today is James Bullard's Double-Header, speaking in Paducah (just rolls off the tongue) Kentucky at an early 1:20 p.m. matinee and a later 3:15 early bird, perhaps the St. Louis. F_E_D Prez generates some excitement in what feels like a very dull, summer market.

Beyond that, today would be a good day for a bounce being it's not too close to the monthly options expiration pin coming Friday and we had several reversal candles in the major averages yesterday.

First though, I suspect we have some strong a.m. weakness to march through.

3C is totally in line with ES and NQ and slightly leading with R2K futures in pre-market.