Wednesday, August 14, 2013

URRE Add-to Long Equity Up over 7%

This was an established long equity position from last week, yesterday I decided to add to it.

While the major averages are all down, URRE is up +7% today at last check.
Yesterday's positive that looked like URRE was ready to launch.

I'll be holding this one for a longer term move, that's the plan any way

VIX Futures Seeing Some Changes

Intraday VXX has been pretty close to perfectly correlated in price vs the SPX (an inverse or opposite correlation), the longer term VXX (which starts at 5 min) is still very positive so nothing has changed there, but what is interesting is the short term changes just recently, starting yesterday and moving in to today (I pointed out actual VIX Futures positive divergences last night).

 Notice the change in VXX underlying trade while the price correlation is still pretty close to perfect with the SPX?

That's 1 min, for more confirmation...

2 min

3 min, so there's an obvious change here that just got underway yesterday and has shown itself to be a trend starting by carrying through today.

The VXX 5 min chart (longer term) hasn't changed at all, it's still leading positive and very suggestive of a lot of protection being bid which is fear of a market crash or at least severe downdraft...

Also remember the signals in spot VIX as well as the Bollinger Bands posted last night.

For confirmation (I'm not including every time frames)...

UVXY, a leveraged version of VXX managed by a totally different group and...

XIV which is the inverse of VXX and managed by a thrid different group. In other words, these confirming signals wouldn't be there if there wasn't something going on.

This is the 5 min VIX futures posted last night

As I said yesterday, if it weren't for a chart or two in each of the averages still suggesting a bounce, I'd be VERY hard pressed to argue for one.

 HYG 15 min positive

SPY 10 min positive.

There is at least one in the 5 to 10 min range for each of the major averages, not so much in the Index futures.

Something is changing here quickly.

Opening Indications

Nothing new under the sun again for the last week. The same negative divergences in to afternoon strength/recovery that have been just about every single day for the last week (plus) were there again yesterday as I reported yesterday and again in the Daily Wrap and the market is moving on them as usual.

 DIA's 3C weakness yesterday afternoon.

IWM's 3C weakness yesterday afternoon'

The Q's were especially interesting after Icahn's tweet

And the SPY's.

I've hear numerous reasons from Carry trades to rotation to Europe before their close, but the fact is these signals have been there and we have been predicting early weakness for over a week now so this is something that's already in place and isn't a spontaneous switch or change in the market.

 My gut feeling is this steady trend is distribution of ANY price strength by various funds.

USO Update

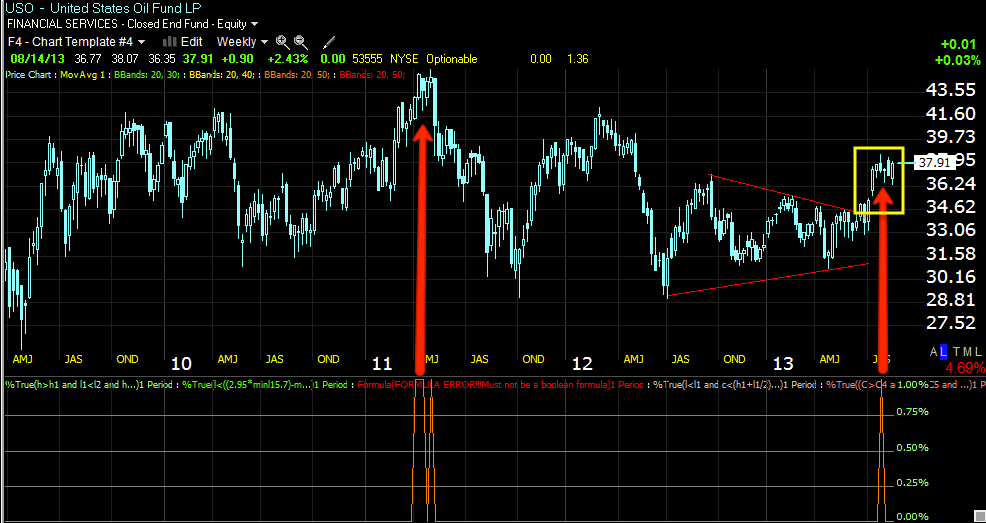
I mentioned USO/oil as a short candidate last night, there are a couple more charts I'd really like to see fall in line before it really looks great, but with the typical a.m. trade period and the 10:30 EIA Petroleum Status/Report coming out this morning, I figured I'd use this time to show you a few things.

 Daily USO, I'm just pointing out Reversal Candlesticks with higher volume and their tendency to be more reliable reversals, a candlestick reversal does not imply a target, it could be a 1-day reversal or something much bigger, the only way I find they imply any target or sense of importance is the timeframe chart they are found on like 1 day vs a weekly chart.

The recent run has seen the real bodies of each candle diminish in size which is a sign of a loss of momentum / health.

 The weekly chart shows a very clear and dramatic drop off in volume through 2013, really this has been going on since 2011.

The yellow resistance zone does look like a tempting stop / limit run on a head fake move so that's one thing that's held me back a bit.

Some weekly sell signals with the last one coming out of a symmetrical triangle that really had no bullish/bearish bias as the preceding trend was a large lateral choppy range.

 The 60 min chart shows the start of the cycle with accumulation to the left and a mark up period in green and now a leading negative divergence.

 The 15 min chart with a small accumulation area and recent distribution- however there are a few timeframes in between these that need to be filled in before I'd feel very comfortable with a new position.

Intraday 2 min USO

3 min USO

This is Crude (Brent) 5 min chart.

I think USO is worth paying attention for a position soon.

Pre-Market

Just as "Blah" as last night. July PPI moved ES a bit, but overall, flat to down a bit as we closed yesterday out at 1692 and are currently at 1689.

About the most exciting thing left in terms of data today is James Bullard's Double-Header, speaking in Paducah (just rolls off the tongue) Kentucky at an early 1:20 p.m. matinee and a later 3:15 early bird, perhaps the St. Louis. F_E_D Prez generates some excitement in what feels like a very dull, summer market.

Beyond that, today would be a good day for a bounce being it's not too close to the monthly options expiration pin coming Friday and we had several reversal candles in the major averages yesterday.

First though, I suspect we have some strong a.m. weakness to march through.

3C is totally in line with ES and NQ and slightly leading with R2K futures in pre-market.

Tuesday, August 13, 2013

Daily Wrap... Summer Doldrums?

Just looking around tonight I wanted to give you my impression or gut feel based on looking at a lot of charts, you know I've expected a short pullback and I demonstrated today how that has been happening right under our noses, disguised in intraday trade wackiness of a.m. weakness and afternoon strength, but the net effect has been such a pullback. You also know I expected a bounce after that, my gut feeling is the market looks like it's in true summer doldrums, but I'm not sure I believe that is what we are seeing.

If I had to make a call on a bounce again this week or tonight based on a lot of charts, I'd say it would be very difficult to see any real strong market upside at all, there's very few areas that even have some of the short term enthusiams that has lifted the markets in afternoon trade. Index Futures look especially weak, as a matter of fact the only place I can find any buying excitement in underlying trade is VIX futures and that's not good for the market.

 5 min VIX Futures building a nice divergence.

 The 60 min is already there, none of the market indexes have this kind of decent signal, not just 60 min charts, but hardly anywhere if anywhere.

The spot VIX seems to be dull, but since the buy signal (the last one took several weeks to fire) note how the Bollinger Bands have pinched on the daily chart indicating the high probability of a very directional move and all indications are it will be to the upside which is the opposite direction of the market's relationship with the VIX.

If it weren't for the 5 min charts in the SPY, QQQ and DIA (10 min in the R2K), I'd not be looking for a bounce at all.

In fact, today's end of day action in 3C looked horrible (as it has for nearly a week which has led to weak a.m. action and afternoon recoveries), I started with the SPY and was surprised at how much worse it looked than it has recently (but the 5 min positive is still there-the bounce), then I looked at the NASDAQ 100 expecting to see better looking charts after the Icahn/AAPL tweet, what I saw was EVEN WORSE than the SPY. The IWM and DOW were EVEN WORSE than the R2K.

This is above and beyond the normal recent EOD weakness.

HYG was flat today and I'm talking about "vs the SPX", but it literally was flat at 0%, Junk Credit was worse with end of day weakness, only High Yield was in line, but not really leading with any enthusiasm. VXX was pretty much right as it should be considering the normal correlation, TLT was weaker in the a.m., significantly vs the correlation, but I've expected this from TLT as well as signs of accumulation which there have been which "should" make TLT a long worth considering or adding to.

As far as Treasury futures, they've lost nothing but ground since yesterday's open, but as I showed you at least a week ago, the difference in underlying trade is striking between the 10 year and the 30 year (closer to TLT), the 10-year doesn't look like it's worth any consideration as a long whereas the 30 year has positive signals in futures as well as TLT.

Commods were oddly flat today vs the SPX, from futures it looks like both Gold and Silver will lose ground, but silver has longer term signals that look good so a pullback in silver may indeed set up a long position. USO has some significant weakness, it's just a matter of a good entry and I think we'll see some real downside there.

I mentioned another site that was making the argument that the USD/JPY carry cross abandoned US assets to buy PIIGS bonds, something I wasn't quite sure I agreed with, but I did see and point out a rotation to another carry cross, the AUD/JPY and I see after hours this same site pointed out what I had pointed out much earlier in the day (I mention it just because they have some decent analysis from time to time on carry trades).

Short term the AUD looks like it could take the market further, short term the $USD looks like it will stay out of rotation a bit longer. While we are on it, the Nikkei futures look like this tonight...
You can see a positive divergence on the 5 min futures to the left and a leading negative that has formed recently, I suspect some near term weakness will be seen in the Nikkei 225.

US Index futures aren't even worth mentioning or showing, they look VERY uninspired. The best I see on a shorter term basis is a bullish hammer (upside reversal candlestick), one in the NASDAQ 100 too, the Dow looks more like a long-leegged Star (not quite as bullish for a short term reversal) and the R2K doesn't have anything going on, it looks very "BLAH".

Internals are no better, there has been NOTHING even approaching a dominant price /volume relationship for at least a week, again, "blah" internals that appear to be "Summer Doldrums", but I suspect it's something a bit more serious.

Sentiment on a short term basis today was in line with the price action in the SPX, that's a positive, but it wasn't leading or showing any "Real" excitement and of course, the longer term sentiment readings are horribly bearish.

There really isn't much more to say, I'M JUST LOOKING FORWARD TO ANY PRICE STRENGTH SETTING UP SHORTS, before some of the better ones crumble (take AMZN's price action for example, I'm glad I already set up the bulk of that core short and this is why I do it before we reach the cliff).

HYG and the 4 averages in the 5-15 min range are all that keeps the notion of a bounce alive, everything else looks really weak, I'd say uninspired, but I know it's something much more than that. The charts before those single charts that represent a bounce look weak as if there have been smaller block trades going through as distribution in to afternoon price recovery (or strength if we can call it that) and the long term damage on any chart above that single bounce chart in each of the averages is SOLIDLY leading negative.

In other words, like I said last week, chasing a bounce here is akin to chasing nickels and dimes in front of a steam roller and I feel bad for any longs that get sucked in to chasing the market on a bounce because I think they are going to get the worst of it. Just to be clear, I don't think we are close to the start of the big picture, I think we are already in it.


EOD Wrap Coming

I have that once a month PITA called, "The Board Meeting" as I so generously volunteered to take on Secretary and Treasurer. In any case, tonight is not going to be a fun one, but I should be back somewhere around 8:30-ish at which time I'll put out the daily wrap as well as any futures action taking place.

Initial charts suggest nothing much has changed today with regard to this same pattern that appears every afternoon in 3C and then every morning in price. Also the expectations haven't changed for trends, except the pullback that I was expecting I believe has already taken place as I showed earlier today.

Bounces at this point in the market take on much less meaning than they might have 2 or 3 months ago, the analogy I used about scrambling for nickels and dimes in front of a steam roller is much more appropriate now to describe the risk:reward outlook of playing bounces.

If it were the weekend I might just take the numerous hours it would take to show you just how many posts were published regarding "Strange" behavior in AAPL that was so out of the norm, I was sure something was going on, I just didn't know what and that's part of the faith I have in 3C, so many times I've seen something going on like we have seen the last few months in TLT and even though it makes no sense at the time, it usually reveals itself at some point, but if you wait for that certainty you miss your chance to make money. The bottom line is we get paid to take risks, it's just whether the risk makes sense and whether we have enough evidence to suggest the highest probability outcome.

See you soon!

AAPL Riddle Solved

Is This what AAPL has been up to?

Way back on February 6th, one of the first posts to address something that was going on in AAPL that was bizarre was addressed in, What is AAPL Really Up to?

AAPL gave a "Buy" signal on our DeMark-ish custom indicator..
We see the sell signal at AAPL's top and a buy on this 2-day chart that led to a bounce and finally this buy on February 6th. AAPL was trading at $457 back then so if you were a long term investor and took that signal, you'd be in the green today as AAPL is around $545 mark.

The Daily 3C chart was even giving a positive divergence signal
"The point is, now there's a relative positive divergence so it seems something is going on here."

Furthermore...

"...there's enough information to tell me something is going on, but is this something that's going to move soon or base for a while to support a stronger/longer move?...Like I said, I don't have the exact game figured out yet, but the range is important and what happens above and below are important."

Yes, I remember this period well, this wasn't the typical, "I think there's a trade developing here", this was something clearly out of the ordinary and we were seeing signs of it at least as early as early February.

In the daily wrap of February 7th I said...

"However the biggest early morning and end of day news may be AAPL which I recently looked at, decided something is going on there, but not having a solid grip on what, what timing, what kind of move, decided to wait for the charts to provide more of an edge than just, “Something is going on”."

If I did a search and sorted it by date and worked from February forward, I could probably produce something along the lines of somewhere near 50 posts just about the odd behavior in AAPL, that AAPL was up to something, but it was very difficult to tell if we were going to see a longer base that could support a bigger move or not and just what in fact this was all about.

In my view, although AAPL lost -45%, it had not seen that capitulation, crazy low wipeout, so I didn't think AAPL had hit an area of fair value where it could build again because before we get to those areas the market must first swing ridiculously lower than any common sense would dictate.

The only thing that made "some " sense to me was a counter trend rally because AAPL was in a bear trend and a rally in this area is pretty normal.

However even that didn't make a lot of sense and I've talked about it recently because the market and AAPL are typically pretty tight and I couldn't see the market going one way and AAPL going the other, but with the size of the accumulation, it seemed like AAPL had to be up to something and this has been an ongoing mystery as to "What AAPL is really up to".

Considering AAPL is the largest valued stock by market cap, when Carl Icahn "TWEETED the following today...


When ICAHN says he has a LARGE position in the largest Cap stock out there, you know its big. It would be absolutely no surprise to see that Icahn was buying in February, in fact considering the facts we have now, it wouldn't surprise me if he was buying before February as hedge funds were rushing out the door at significant losses.

I guess now we know what this was all about, like I say, 3C will often show us things that we don't understand and often by the time we do, the money has been made.

The two largest 3C accumulation signals.

AAPL 4 hour.

I'm not knocking Icahn's smarts or talents, just saying, he doesn't let anyone push him around, when Bill Ackman and Carl Icahn had a screaming match on CNBC and Ackman had made it very clear he was short Herbalife, Icahn bought and otherwise locked up so many shares of Herbalife that I'm pretty sure Ackman still hasn't found the supply to cover.

Just saying... I wonder if an AAPL store manager ticked him off and he said, "Do you know who I am? I'll buy this company and fire you!"

Hey, he can do it and make it work.


FSLR Follow Up- Sept. $38 Calls & Charts

I wished I had done what I normally do and went with Sept. expiration in the first place, this is what has worked for me and with a few exceptions, I typically regret not following my own guidelines with options like buying in the money and usually at least 3-4 times more time than you think you'll need.

As for FSLR, the range it formed the last week or so was VERY obvious, this means stops and limit orders fill up there and it makes it worthwhile to run those whether it be for the spread, the order/volume flow or picking up shares on the cheap in good supply. you really can't ask for a better situation if you are accumulating in size.

The reason I feel fine with FSLR when the market is not looking quite the same is because FSLR made up a lot more ground today that I anticipated.

 The 1 min chart looks a lot different than all of the market averages just posted in the last update.

 This 2 min chart looked pretty good earlier, I didn't expect that it would lead positive today above yesterday's 3C range.

I really didn't expect FSLR to make it to the 5 min charts the way the market was acting, after taking out a very clear zone where stops and limit orders will accumulate, I look for accumulation to back up the probability of a head fake or in line trade that suggests it is a market break lower and not a head fake.

 This is a closer look at the 5 min, it's almost exactly opposite the market averages which are going more negative on the 5 min chart toward the close, this is leading to new intraday highs.

Then to see the 15 min chart move, that was more than expected.

15 min FSLR today, that's a lot of intraday movement.

Adding FSLR Calls, likely Sept. $38