Monday, November 18, 2013

MCP Longs, Pay Attention

The $4.70 level was key last week, we are above that and look to gap up, this could get interesting in a stock like this real fast.

A.M. Observations

As I said Friday...

""If the intraday charts hold up through the close, then I'd say Monday opens up or in the area, however because of the significant damage already in place, I'd think the most likely scenario would be that it closes down, perhaps that bearish engulfing pattern I was talking about in PCLN, it would fit well in any of the averages as well."


And then last night, "Even though we don't have such an open so far in futures...The rule applies to the averages in regular market so the opening futures Sunday night wouldn't apply, it would be the early trade Monday. Looking at the closing intraday charts, it's a coin toss as some like the SPY held in to the close and others didn't, but all in all, I tend to agree with the basic assumptions of that late Friday post, once again with an additional area highlighted as well..."

As of right now, we are about 1 ES point from the 4 p.m. Friday print, right where we left off.

China had a big night, the Shanghai Comp. was up some 2.87% on both the Chinese Third Plenum reforms and I expect more so on the way China will now calculate GDP, adding "Research and development " costs to the bottom line of GDP, mind you I said ADDING, this is nothing new for the U.S. and Europe so some of those 0.1% prints might have been recessionary had it not been for that neat accounting gimmick, but if the US and Europe are doing it, why shouldn't China compare apples to apples?

Housing inflation in China is still up, but slowing so the PBoC may just be tinkering and tweaking liquidity, we'll see overnight in to tomorrow.

Europe followed China's / Asia's lead and the DAX hit an all-time new high, the FTSE-100 was the laggard.

Other than that, there's nothing too special about futures, the market will pick up pretty close to where it left off, the 16k and 1800 levels will be hit as it's nearly impossible for them not to be this close with such magnetic force of centennial/whole numbers pulling like a tractor beam, it's what happens next.

As mentioned last night, we have a bevy of F_E_D speakers on deck in front of Wednesday's minutes.

Gold still looks like a pullback or it is putting itself back together after the pullback expected last week at least in to the gap.

Oil looks very much like it's continuing to develop the right side of a bottom that we've been expecting for a pretty big upside move so USO will be on the radar today.

Treasury futures are pretty flat, I'm guessing they're in a holding pattern until they hear what the F_E_D speakers have to say.

EUR/JPY was wide chop through the night, USD/JPY looked worse as it looks to be rolling over. AUD/JPY looks to be the best performer, it is choppy, but less of that downside drift and I suppose that's because of the Asian/Chinese markets which the AUD is very sensitive to.

Other than that, it's pretty much a normal Monday a.m., although the media is ready for a 16k/1800 ticker tape parade.

We'll see how things look as we get that business out of the way.

Sunday, November 17, 2013

One More Thing

I forgot to mention China, the last time they skipped 3 reverse repos in a row is about the time the market went lateral for those 2.5 trading weeks, therre were a lot of signs the market didn't like that and it just happened again Thursday so we'll see what they do moving forward, but it really seems the market doesn't like it and the smaller banks in China may end up in some real liquidity trouble.

Also, while I was posting the Week Ahead, something happened to the Yen (up) and all of the carry pairs are getting crushed right now. It "may" not be the open I had imagined late Friday.

The Week Ahead

I hope everyone had a relaxing, safe weekend.

I'll start where we left off Friday which is the 3C chart action in to the late afternoon on an op-ex day, it's never price that tells me much as the op-ex pin releases because most contracts are cleaned up by then and the pin no longer matters, it's the underlying action because that is what I see most often, pick up right where it left off near the close on Friday.

That's the reason for this post late Friday To save you some time I'll give you the gist, the first sentence/paragraph read as follows...

"If the intraday charts hold up through the close, then I'd say Monday opens up or in the area, however because of the significant damage already in place, I'd think the most likely scenario would be that it closes down, perhaps that bearish engulfing pattern I was talking about in PCLN, it would fit well in any of the averages as well."

Even though we don't have such an open so far in futures...
ES (SPX) Futures open Sunday night below Friday's closing print and move lower thus far.

The rule applies to the averages in regular market so the opening futures Sunday night wouldn't apply, it would be the early trade Monday. Looking at the closing intraday charts, it's a coin toss as some like the SPY held in to the close and others didn't, but all in all, I tend to agree with the basic assumptions of that late Friday post, once again with an additional area highlighted as well...

"If the intraday charts hold up through the close, then I'd say Monday opens up or in the area, however because of the significant damage already in place, I'd think the most likely scenario would be that it closes down, perhaps that bearish engulfing pattern I was talking about in PCLN, it would fit well in any of the averages as well."

One of the reasons I can see this is the charts (intraday late Friday), another reason is that SPX 1800 isn't that far away and it's a major psychological factor and it's less than 2 points away, that's a fraction of a fraction of a point away. Friday the SPX was up +.42% (less than half a percent ) on SEVEN and a HALF Points, we need LESS THAN 2 POINTS!

How can we not go there?

The Dow-30 is less than NINE POINTS away from 16,000, it moved 85.5 points Friday for a 0.54% gain. AGAIN MY POINT IS, THESE MAJOR PSYCHOLOGICAL MAGNETS ARE A FRACTION OF A FRACTION OF A PERCENT AWAY.

The third reason is in the paragraph above from Friday..." I'd think the most likely scenario would be that it closes down, perhaps that bearish engulfing pattern"

Something like this perhaps...
16k is hit, any orders above that can be taken and we "could" end up with a bearish engulfing pattern like this, that part isn't in the intraday 1 min charts, that's in the more important ones.

Those reasons can be found in this post from the EOD Wrap Check out: High Yield Credit in that post in to the close,  or the 60 min VIX futures, the intraday VXX, the spot VIX Bollinger Band Squeeze, the ES 30 min chart in to the "Head-Fake" area or the NQ charts of the same, The IWM or QQQ charts, look at the Financial sector charts or Technology and DON'T MISS AAPL. These are the reasons a candle like the one above is not hard to imagine with the intraday charts from Friday in the post linked at the top of this one, I could keep going, but there are a lot of posts dealing with things more specifically.

As I look at the area I think is VERY high probability a head fake area after nearly 2.5 weeks of FLAT trade in the major averages (as we see head fake moves so frequently at reversals and especially important ones, which Is why I expected one after the range was so well defined after nearly 2.5 trading weeks of flatness) I also took a look at some other indications that I found interesting.

For example...
 The cycle is clear across all of the averages, it started at 10/9 lows in all of the averages, showed reasonable stage 2 markup after the stage 1 accumulation in to the 10/9 low and then the distribution area in to the flat trading range which is one of the most obvious places we see accumulation and distribution.

I typically say about 80 of all reversal in any asset and any timeframe have some sort of head fake move, "The Igloo with Chimney" which is similar to the SPX above. 

The yellow arrow represents the nearly 2 and a half trading weeks of flatness/choppiness...HOW FLAT? The SPX gained about 0.45% during that area of nearly 2.5 TRADING WEEKS!


 The IWM is similar (Russell 2000) except instead of a false new high breakout, the IWM put in a bearish "Channel Buster" which I think is going to be a text book example of how a Channel Buster works and one of the reasons I decided Friday to add an IWM December $111 Put in addition to the SRTY (long) trading position.

The 3-day head fake isn't to a new high as the IWM was already trending down, but the 3-day head fake move is the same, it's just a different type of a  head fake move.


The NASDAQ 100 looks almost exactly the same as the SPX, the same range, the same 3-day move above the VERY OBVIOUS range and creating what would be the same head fake move we see at reversals which in this case would be called a bull trap rather than a channel buster.

If we look at the 5 min charts of the Index futures for these areas (where the head fake moves occur) we get a pretty clear picture of underlying trade not just in the averages, but Index futures.

 ES 5 min 3C chart over Wednesday, Thursday and Friday, the same 3-days.

 TF 5 min

NQ 5 min...

Notice a theme? You may remember the IWM charts as well, I sure do, they're beautifully formed.

BUT THIS ISN'T BREADTH, THAT'S WHAT I WANTED TO SHOW.

Breadth doesn't lie, it's a straight count of how many stocks did or did not participate and gives you a good feel for the strength of a market or weakness. 

For example,  as the SPX was making new highs Friday, of the approx. 2800 NYSE stocks, only 228 made new highs with the SPX making new highs!!! Would you not find that troublesome?

These are "Breadth Charts", they compare (typically) NYSE component stocks vs a comparison symbol which I have set to the SP-500.
 Looking at the NYSE Advance /Decline line I see an A/D line (green vs SPX red) that hasn't cleared last month's A/D high and certainly not with the SPX. THE LAST TIME THE A/D LINE DIDN'T MAKE A HIGHER HIGH IN AUGUST THE SPX LOST -80 POINTS.

 The NASDAQ Composite (ALL NASDAQ listed stocks) isn't able to clear last month's A/D high either...AND THIS WHILE WE ARE MAKING NEW HIGHS? With the Index 3C charts and averages, credit, Leading Indicators, etc, it's not hard for me to believe these are the head fake moves we expected after the range became so clear (plus we hasn't seen a head fake move to that point) and the head fake moves that accompany a reversal so often (usually JUST BEFORE the reversal).


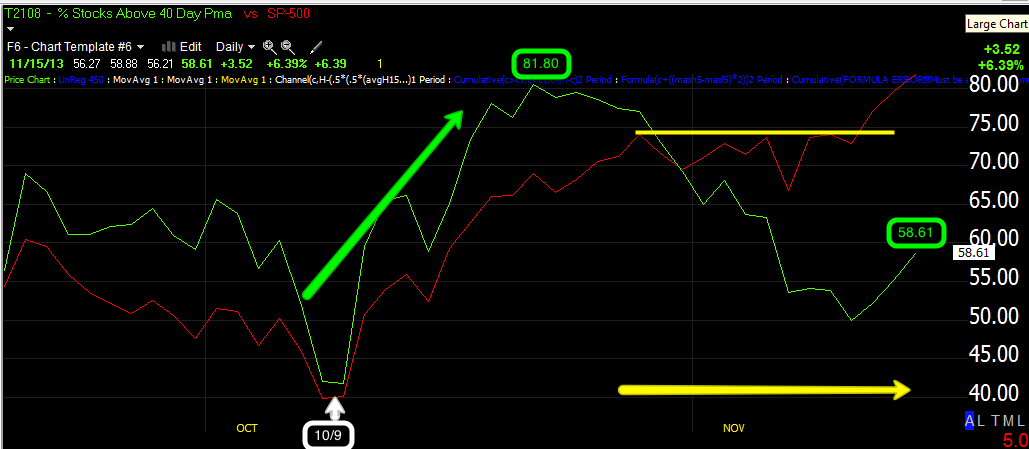
 Looking at the Percentage of NYSE Stocks that are ABOVE their 40-day price moving average, since this cycle started on 10/9 they rose as they should have in the "mark-up" phase to almost 82% of all NYSE stocks trading ABOVE their 40-day price moving average.

However, as the SPX breaks out the last 3-days above the range, that percentage is now 58.61%! Wouldn't you expect it to be at a new high above the former 82% high?

The Percentage of NYSE Stocks Trading TWO-Standard Deviations Above their 40-day Price Moving Average (these re typically the momentum stocks)  has dropped from 42% when the SPX was actually lower (red) to a mere 17.13%! 

Forget 3C, forget Leading indicators, this is cold, hard math, there's no interpretation here, there's no bias, there's just fact. You have to decide what you think of those facts, I've spent a good part of my trading career watching market breadth and this is not good, it's not typical.

As for the longer term 3C trends, I've showed you the daily Index futures and what has happened in 2013...
 ES daily 2013...

NQ Daily 2013...

TF (Russell 2000) daily 2013...

Now look at the Percentage of NYSE stocks Trading Above their Simple 200-day Moving Average (a measure many use to determine whether an asset is in a bull or bear market)...
From the New year 81+% of NYSE stocks were above their 200-day moving average. In May that dropped to a HIGH of 75.43%, in July at the high, 61.12%, then 55% and now 53%. 

Nearly half of the NYSE is trading BELOW their 200 day moving average, but more specifically, as the SPX has gained 5.18%, the percentage has dropped from 61% to 53%, at the lows, 43%.

I think there's more than just 1 cycle (timeframe) that we need to be looking at here.

As for what's ahead...

We have a lot of F_E_D speakers this week, an unusual number, I wonder why? Could it be the release of the F_O_M_C minutes on Wednesday? Remember the last time the F_O_M_C minutes came out and half the participants wanted to end QE by the end of 2013 and the market nearly dropped a... rock? Then after the close, Bernie comes out saying that "Accommodative Policy" is here to stay for a long time?

Then the market went nuts to the upside, I was saying the entire time, He's not talking about QE,  holding interest rates low until 2015 as the market expected is "Accommodative Policy", "He's using ambiguous, plausible deniability" to counter-act the horrible F_E_D minutes!

Then after a few weeks Bernie said, "I never said anything about how long QE would be around, I was talking about holding interest rates down for at 6 months after we conclude QE" !!!!!

In any case, there's a lot of speakers there, a lot of chances for all kinds of knee jerk reactions as they are both doves and hawks.


In any case, there are a lot of charts looking really bad, really quick, I'll be looking at AAPL early in the week as it seemed to fall apart almost instantly.

Have a great week, I'll see you in a few hours.

Friday, November 15, 2013

Weekly Wrap- Is QE Losing it's Luster?

Lots of interesting things happened this week, we finally exited the chop zone we had predicted which lasted nearly 2.5 trading weeks, the range was so obvious that I had called for a head fake move several days leading up to the move finally taking off and what did it take off on?

Well you may not remember but we had some really nasty actual signals and they sent ES futures (SPX) 10 points overnight, however in the morning the Wall Street Journal released an article in which the ECB for the first time mentioned "Asset Purchases" which means QE even though the European Central Bank is expressly forbidden from financing any country's debt so what do they buy? Eurobonds? I'm not even convinced they were serious, but after a .25 point surprise rate cut that held the Euro down for several days and then let go, they tried a different angle; this time the Euro was down for a few hours before heading higher, but the equity markets loved the idea of more QE, even if it is European.

Then, interestingly after hours Wednesday Yellen's prepared comments for the Senate banking committee were leaked just before the Thursday interview; the dovish release failed to move the market much (ES). Yellen came off as an unapologetic  Dove and while the markets moved, I don't think the move can be distinguished from a head fake move that was ready to launch anyway, even if  the market was up on the probable new Leader of Liquidity (who seems more dovish than Bernie by a far sight), the market sure didn't have the 400 or 500 Dow point response you might expect on a bigger dove taking over the printing press.

Then overnight Shinzo Abe and Kuroda's QE-Zilla from the BOJ is failing horribly as was evident as soon as it started, just read my currency crisis articles written days after QE was announced and see the trouble already immediately present.

Well it seems they figure if a lot is not doing anything, then more should...??? I guess they haven't learned anything from the 3 US QE episodes, but it did manage to send the USD/JPY over the benchmark 100 level.

Then, once again China's PBoC skipped out on the regularly scheduled Open Market operation of reverse repos on Tuesday and Thursday to inject liquidity in to the market, you may recall the last time they skipped 3 consecutive reverse repos and the market showed us many signals that it didn't like it, well they skipped out again Thursday and the Money Markets went through the roof, overnight repo rate rocketed up to 5.32% which is the biggest 2-day jump since China engaged in a huge June liquidity draining exercise that sent overnight repo rates up to 10%. Apparently smaller banks are liquidity starved and China needs loan growth for GDP growth, but apparently they are concerned with inflation(likely real estate) again and the market just doesn't seem to like it when China does this. As mentioned earlier, it may have been a shot across the bow of the F_E_D, ECB and BOJ all talking up QE this week one way or another. Net/Net, China DRAINED liquidity from the economy this week.


So how did the week shape up and end up?

Credit was VERY interesting because this is the institutional asset used to express a risk on position, long term it's severely risk off, but short term...
 High Yield Credit made an unusual and very deep move down today, we saw some yesterday in the Daily Wrap, but today was very clear, credit players (some of the smartest and best informed out there) wanted nothing to do with any market ramp.

While it may have looked like HYG was risk on, the underlying trade showed something quite different which was first noticed yesterday (after the Chinese reverse repo failed to go to market).
 That is a HUGE, sharp decline in 3C this afternoon in HYG credit, this is the form used for arbitrage and whoever had been supporting it just threw in the towel for the second time in about a week.

Here's a 3 min chart, HYG doesn't look like it will be up much longer and the market won't like that, but the reason HYG is seeing distribution is the real question.

As far as QE-Sensitive assets...
 30 year treasury futures on the week saw a positive divegrence in 3C and moved up into Yellen's y\testimony, but after the 30 year saw distribution and traded more QE OFF than you'd expect.

 This is the benchmark 10 year Treasury Futures and they traded QE on in to Yellen's testimony, but saw distribution after and lost gains in a QE OFF manner. Note how the 10 year looks worse than the 30 year as I have been saying for months. Hopefully we get a pullback in TLT down to $100 or so, then I'm interested in a long position. It looks like we'll see that early next week in a QE-OFF manner.

Gold which may or may not be sensitive to QE right now was QE on into Yellen's testimony, but again, after, a 3C negative divegrence. It seems perhaps the market expected Yellen to be more dovish than she was?


The longer term 60 min $USDX futures look like a $USD pullback which would be QE on, but it may have nothing to do with QE as it seems clear, the trend above was QE ON IN TO YELLE'S TESTIMONY AS IF THEY EXPECTED MORE AND THEN QE OFF AFTER HER TESTIMONY AS IF THEY WERE DISAPPOINTED THAT SHE WASN'T DOVISH ENOUGH WHICH I CAN'T IMAGINE.

As for GLD and GDX which have been a thorn in my side this week for the December call positions...
 It's this GDX 5 min leading positive that has me still long those calls, I think a pullback will see additional upside gains shortly. In fact...

The intraday 3 min chart went negative, GDX pulled back, but didn't fill the gap and started showing positive divergences in to the pullback which is exactly what I want to see considering I'm leaving the positions open for now.

 GLD's 30 min chart shows some real strength, it could be more, but for now, it's significant.

The intraday 3 min chart shows accumulation in to the lows and then a negative divegrence like GDX suggesting the pullback I expect on a gap fill before heading higher. There may be some great opportunities to buy a pullback in either early next week.

Looking at the VIX and VIX futures, as mentioned earlier in the week, it seems  there has been stealth VIX futures accumulation as someone seems quite worried about something.
 We have large accumulation this week on a 60 min chart, it seems to be stealthy, I doubt anyone would notice it without 3C except maybe relative performance...

 Like this chart VXX / UVXY refuses to make a new low as the SPX makes new highs, there's demand there and that's what we are seeing in the 3C charts.

Additionally the SPOT VIX with my custom buy/sell indicator that has worked fantastically, is showing a tight squeeze in Bollinger Bands suggesting a sharp breakout (market down) or break down (market up), considering relative strength and 3C divergences, I think VIX blasts higher taking the market down as a head fake move in the market looks like it is near complete.

For example... you saw the 3C charts for the averages today, how about the Index futures...
 ES 30 min shows accumulation in to the mini cycle I identified before it made the lows, the range to the left was distribution and just needed the chimney on the igloo, a head fake move and it looks like we have that in place with a leading negative 3C divergence telling us it's a false move rather than a confirmed breakout.

We see the exact same in NQ/NASDAQ 100 futures on a strong 30 min chart. The 5 min charts have been negative several times this week, that has accrued on these 30 min charts.

Additionally...

Yields lead the market, when they were above the SPX (green arrow) the SPX moved up, now they are below, yields are like a magnet for the SPX.

 XLF/Financials show the entire cycle since 10/9 lows , accumulation, distribution and head fake move.

 XLK long term cycle shows something similar, but closer by...


Since the mini cycle, distribution which is why I like TECS.

Speaking of Tech, AAPL which I warned about last night....

The 5 min AAPL chart was warning...

Today the 10 min chart was screaming, AAPL looks like a great swing short.

I'll have more over the weekend, but that's it for now. Enjoy your weekend!!


Checkout AAPL Short

End of Day Update

If the intraday charts hold up through the close, then I'd say Monday opened up or in the area, however because of the significant damage already in place, I'd think the most likely scenario would be that it closes down, perhaps that bearish engulfing pattern I was talking about in PCLN, it would fit well in any of the averages as well.

I chose IWM because of the divergences, because of the momentum associated with Channel Busters on the reversal and because the IWM ran to the upside, lowering the premium (like shorting in to price strength).

Many leading indicators intraday are unremarkable or in line, but High Yield Credit is not one of them, it has fallen off badly as it started yesterday and the most important credit asset, HYG looks like this right now, something very nasty going on there as they are flocking out of HYG as it follows the SPX.
 High Yield Credit vs SPX falls apart today "Credit leads, stocks follow"


HYG after a failed attempted upside reversal seeing strong distribution.

A closer look at that distribution on an upside move.

The 3 day chart...

As I said above, I would think a higher open "IF" the intraday charts hold in to the close, that doesn't look so sure anymore.

Right now the SPY is the only one still hanging on.

 QQQ 1 min intraday falling off badly

 2 min was already there, but now worse.

IWM intraday was trying, but it's failing even late afternoon only

2 min chart and this is one of the reasons I went with the IWM puts, the timing looks great.

Opening IWM December $111 Put position

Opening IWM Put

I don't have the strike/expiration yet, but I'll let you know shortly. There's a huge distribution event in HYG even as it tracks the SPX and several other nice signals that this ramp should be used to short in to and I prefer a put in this case.

QQQ Would probably be my second choice and I may even look at a put there.

I do have 3x leveraged shorts like SPXU, SRTY, FAZ and TECS, I would use any of those as well if I didn't already have them as trading positions.


And There's the Post 2 P.M. Ramp

In the market update posted at 1:58, I said it was very likely because of intraday signals that there would be an afternoon ramp or closing ramp, it's pretty irrelevant, the charts are what matter, you can find all of it in this update  that I just put out an hour ago.

You can see it clearly in my Custom SPY/TICK Indicator.
SPY TICK