Monday, November 18, 2013

MARKET UPDATE: HYG Negative Divergences Taking it Lower

This isn't an asset many of us trade, but it's a very important asset with regard to supporting or inflating the market, in fact, take a look at these two charts and see if you notice anything that might help the market make a head fake move-perhaps partly op-ex related (I'm guessing the pin HAD to be UNDER Dow 16k and SPX 1800).


Notice anything? In case you couldn't see it, HYG is the first chart above and the SPX is the second chart above. The SPX/market being up is not removed from HYG being up, in fact it's a "Chicken or the egg issue", however from our long experience tracking Arbitrage assets that are used to manipulate the market, HYG came first, maybe it's not driving the market by itself, but it is driving.

So then what should we expect from the following?

Friday there were some sudden and deep negative divergences, there are others setting in and another reason this is important is pretty much related to the first reason, "Credit leads, equities follow", it's just which way is it leading?
 This is the 1 min chart with accumulation right before the market made the (likely ) head fake move of the previous 3-days.

Look at the leading negative divegrence from Friday and in to today. Note the dates I have highlighted.


 The 3 min HYG chart is horrible looking, leading negative right after the 3rd day is completed in to OP-EX.


The HYG 5 min chart

And the 10 min HYG chart is seeing migration of the divergence so this looks to be a fairly strong round of distribution, so if that takes HYG lower, you saw how HYG leads the market.

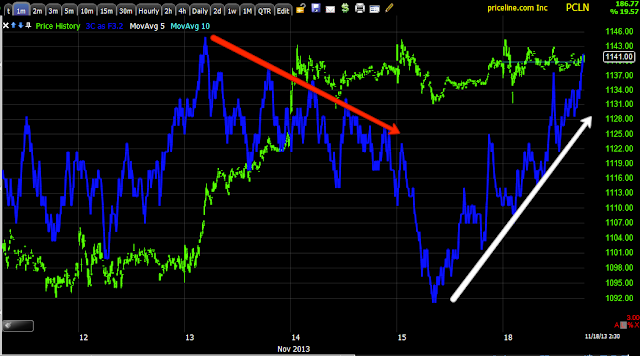
PCLN Update

I hold a PCLN core short equity position  that is pretty much there, but could be filled out, but I'm not focussing on that, I'm more looking at PCLN  from a trading or Put option perspective (especially the later.)

This is the last PCLN update...

You may recall I liked the breakout on Wednesday, but couldn't add to the core short or open a trading position because I don't believe in "V" reversal events, but more of a process so  I said I was hoping to see something like a few Dojis or Star candlesticks to give PCLN a reversal (rounding) process, so far so good.


 And there they are, with today thus far, I have 3 Star/Dojis and a wider. rounding reversal process in place.

THIS HAS CREATED A NEW PROBLEM, actually maybe it's really not a problem, but a great timing indicator.

The 3 Star/Dojis have created a VERY obvious line of resistance on an intraday chart.


 There it is on a 60 min chart. So I have alerts set for a move above that range around $1145 and I'll be looking immediately because a majority of all reversals have a head fake move, no matter the timeframe.

In this case, that could be used to set up a Put position because I want to buy the put in to price strength and underlying weakness.

THIS ALSO TELLS ME THAT THE TRIANGLES IN THE MARKET ARE LIKELY TO SEE A HEAD FAKE MOVE TO THE UPSIDE BECAUSE PCLN WILL LIKELY NEED THE HELP AND IS IN A WAY, A REFLECTION OF THE BROADER MARKET.


 30 min PCLN leading negative in the range area so that's good, I'd need to see a move above $1145 and charts like 1, 2, 3 and 5 min get real ugly on that move and I'd enter a put position or add to the core short or both (1 as a core trend position, one as a trading position).

 This 3 min chart in the range of Dojis and the same area as the market head fake is perfect, this is the kind of intraday 1 min move I'd like to see not only in PCLN, but market wide.

THIS IS THE KEY, THIS 1 MIN CHART LOOKS LIKE IT WILL MAKE THAT INTRADAY HEAD FAKE MOVE ABOVE THE 3-DAY DOJI RANGE, THIS SHOULD BE SIMILAR TO THE OVERALL MARKET.

SET THOSE ALERTS

XLK (short) / TECS (long)

As mentioned TECS is already a long trading position in place which is doing fine, I mentioned again I do like TECS (short technology and I made specific mention to AAPL's weakness). I think you might get a chance to look at a position in one of these if you are interested just based on the TICK data at the EOD today.

Note how XLK's daily doesn't look that different than SPY or even IWM below...

 Friday the charts suggested a gap up with a close below Friday's open, a bearish engulfing pattern.

However that doesn't mean there won't or can't be bouncing around this move, although it was a serious move. I have to take a closer look at internals, but the TICK data seemed to indicate the market trying to bounce a bit


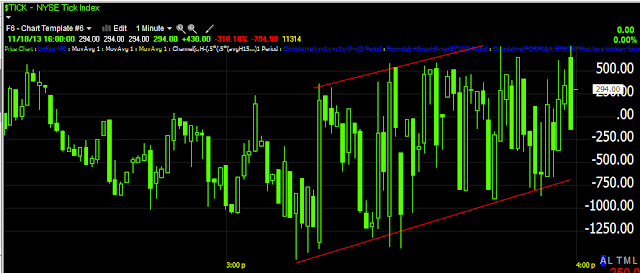
 Today was REALLY mellow and TICK was about +/- 750 until later when it hit an extreme of almost -1600.

In to the last hour or so, you can see the TICK trend changing, this is good early warning, so we might just get some opportunities to enter some additional positions on price strength/underlying weakness.

 Here's XLK 10 min, it hasn't confirmed for quite a while. There are reasons I'll hold a position like TECS that may be down (only 5% for a 3X leveragedETF so it's not bad), but the decision I made is based on more than just price, price is one of the most deceptive indications in the market.

 This is the entire cycle from the 10/9 lows, there was accumulation and even a head fake (stop run) move in to those lows. Distribution was heavy in the range area and the head fake move here is the same 3-days as the rest of the market, the previous 3-days and 3C looks worse there.

 This is the 5 min chart, there's clear deterioration where the head fake move is.

And this 3 min trend chart I trust needs no explanation as that is the clearest divergence you can ask for.

 As for TECS, short term charts are difficult because trade is spotty, but it's very clear here on this 3 min chart.

Ot take the 10 min chart's extreme positive divegrence the last 3 days, but especially today.

I don't want to chase anything, but on any strength I think XLK short or TECS long would make for nice trading positions or even ad to's.

In to the close

The TICK looks like it's forecasting a ramp in to the close to try and recover some of this downside, you may be able to use it or may want to exit trading positions (very short term ones) here.

AAPL Put Set up

First, I DON'T want to chase ANYTHING

I'd like to see AAPL move above $522.60 or higher to set up a put position, I mentioned AAPL Friday and showed charts of it over the weekend / late Friday.

I think this initial market meltdown will see the "But the Dip" crowd come in and set up some more opportunities, one I'm looking toward is AAPL.

 This is the AAPL 15 min chart, it has gone from in line to leading negative and AAPL is still close to being within a range , actually it is, so it works.

 This 10 min leading negative divegrence caught my attention, since Icahn is getting all of the credit (do you know how many banks, Investment fund managers and Ex-F_E_D officials have said the same thing in the last 3 weeks, but they give Icahn credit!!!!) perhaps Icahn is the one selling here.

And the 5 min so AAPL is REALLY close, it could probably be taken now, but I'd rather not chase and rather enter a put on price strength and a lower premium.

GLD / GDX

So far not only are GLD and GDX holding up well on a relative basis, but they are making the kind of lateral trend intraday that is needed for the reversal process so it looks like this one is going to pan out too.

Even though USO took a little hit, it's still well within the reversal process so it looks ok too.

I'm actually impressed with both GLD and especially GDX thus far.


There She Blows

I want to keep tabs on this market, there certainly can be head fake moves in a Crazy Ivan this sharp, but when there are, it's a pretty broken market.

So far it looks like those last 3-days were a head fake judging by the speed of the decline and the number of issues declining.

Last week one of the things we noticed was stealth accumulation of protection in VIX Futures which is why I opened the a lot of the short positions like IWM puts which are green double digits right now, but I want to keep an eye on this and where other opportunities are, but in general, head fake moves (the last 3-days) are the opportunity.

 UVXY intraday 1 min

However this is where the position started when the character changed on the 14th, I'm pretty confident this position will do very well.

This is the 1 min actual VIX futures...

And the 60 min which is much stronger, the stealth accumulation of protection I talked about last week is particularly strong during the market's breakout above the range.

FAZ / TECS (LONG)

I'm just reiterating I still love both of these positions to play weakness in Financials and Tech, both are 3x leveraged inverse or shorts.


XLF Just Went VERY Negative

Some have been asking about FAZ long which I'm holding, XLF-Financials just went VERY negative, I'd say FAZ is a good choice and you can always through a tight stop under intraday lows.

Market Update

Here's a quick look at the averages, pretty much for the most part they are loitering around the Psychological whole numbers, however there's damage as there was and shown in Friday's EOD posts.

 SPY 1 min just loitering around a triangle, it's not even clear what will happen with the triangle, I'm certainly leaning toward a break under the triangle and maybe a closing candle like a bearish engulfing, but there may be a Crazy Ivan shakeout first or a head fake move first.

Intraday charts are really bland, especially considering these highs. Volume too has been VERY bland.

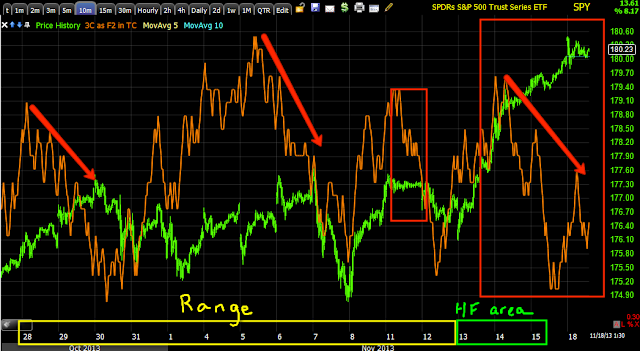
 Looking at the SPY from the range and the previous 3-days above the range this leading negative 10 min doesn't bode well for the market.

The Q's 1 min intraday is loitering with no 3C or price direction.

However...
 at 2 min it is pretty clear what's going on with the QQQ, THIS IS WHY I SAID THE QQQ WAS MY SECOND CHOICE WHEN OPENING THE IWM PUT ON FRIDAY.

The 15 min chart is pretty clear as well and makes perfect sense with the HYG signals from the last post.

 IWM 1 min again, listless

At the 2 min chart, HUGE difference. You can see where there was accumulation for the "Channel Buster" breakout and you can even tell that a Channel Buster like this is unlikely to hold just on the small accumulation zone.

The 5 min IWM and Channel Buster, that Channel Buster is EXACTLY where the previous 3-days that broke above the market range are.