Tuesday, December 10, 2013

Trade IDea: BIDU

Now that's what I was talking about. Adding 1/3rd to bring BIDU short equity to 2/3rd full position

GDX / NUGT / DUST

The NUGT/ DUST switch-off in the Trading Portfolio (that I'm trying to maintain as an experiment to see if I'll have the time I need to start trading again without compromising any of my work here and without putting my hard earned money in danger because I don't have the time to properly risk manage and otherwise manage positions. I think a real, live portfolio (smaller in nature because they are the most challenging to manage) will be beneficial as an example portfolio, but it isn't meant as a "Follow my positions" portfolio because the positions entered are a function of what exposure I have, what looks good at the time, etc, it's not the best of the best, it's just the best for what's available and my time at the time, this is one of the things I fear most, that such a portfolio (which would be easy to display) would become a "follow me" portfolio which it's never meant to be, I'd trade just about any position I highlight.

In switching from NUGT to DUST I am NOT implying by ANY means I no longer like GDX (gold miners) or the 3x long gold miners, NUGT, I'm simply expressing my opinion that the gap created today is likely to be filled. Upon any gap fill (total or partial), I will re-enter NUGT long as a trading position and I have one as a long term position that is staying in place.

The P/L on the NUGT position just closed looks like this...

As for the charts that made me make up my mind, the gold charts had something to do with it, additionally the NUGT and DUST charts also had a role.

This is the overall probabilities, as I say, "Go with the probabilities" and on a 60 min chart, these are strong. GDX...
 Leading positive divegrence, it looks like a stage 1 "W" type base is complete with a head fake move already in place and accumulated with the highest level on the chart.

Thus I love NUGT, the DUST trade is just a counter-trend (3C) trade.
 NUGT 60 min is also very strong like GDX.

NIGT 30 min is very strong so I have no problem with the probabilities of gold miners (GDX/NUGT) higher .

The 10 min chart and a very impressive leading positive in the head fake area where supply and cheap prices make it easy and advantageous to accumulate, however today created quite a gap and gaps over the last several years have been filled in a very thorough manner-I wish they weren't.

 NUGT 2 min chart tells me it looks like a pullback in to the gap is likely, otherwise I want to keep a fairly short leash on DUST as it's not a probability trade, but a counter trend so I don't want to be stuck with it when I don't believe in it longer term.

DUST 3 min has a similar/opposite leading positive on its gap down this morning. This is why I'm trying to trim around the fat or thread the needle and close NUGT at a slight gain and try to pull some out of DUST before heading back to NUGT hopefully at a lower price.

DUST 5 min shows a very different chart, leading negative so I don't think it has more than a gap fill/bounce in it.

 DUST 30 min is interesting to study, but the punchline is the current highs have a sharp leading negative 3C divergence, like GDX has a leading positive, that's good confirmation.

Remember the NUGT and GDX 60 min positive charts, DUST 60 min is the exact opposite as it should be, leading negative, thus I only see a bounce in the gap at best, after that I'm looking to re-enter trading longs in NUGT.

Trade Idea: NUGT / DUST

I love GDX and NUGT long, but for a very short term trade in the new trading portfolio, I'm going to close down the NUGT long which was the only of the 7 longs that was in the red about 15% and now in the green, but that's not why, it's the gap fill and I'm going to add DUST long for a short period (gap fill) charts will follow.

All core positions, longer term  positions and so far option positions (especially out to Jan. expiration) will stay as is.


Intraday Market Charts

As mentioned there's an intraday 1 min positive divegrence, all new divergences that may become significant start on a 1 min chart, but otherwise the 1 min chart guides intraday trade, I've been watching to see if this 1 min builds (suggesting there's a new divergence starting, perhaps regarding the talk of a possible budget deal in CONGRESS between 2 (1 Dem and 1 Rep. budget committee leaders), this is far from a congressional vote and passage of such a deal and far from the Senate accepting the same as well as the president so it's actually in its infancy.

The fact intraday prices look like they'll move as they should with an intraday divergence suggests this is an intraday steering divergence and that's all. This is significant because starting at 2 min charts, they get pretty ugly on the negative side, but for now this is what the 1 min positives look like which is why I have told a few members I'd wait on things such as VXX long, which may be a position available later today, but with an intraday move, it wouldn't be great timing.

These are the 1 min intraday Index Futures (SPX, NDX, RUS2K). If I was back in my day trading days, I'd likely be getting ready to put on a leveraged long with a cross of the SPY above the 5 min 50-bar average.

 ES 1 min positive

NQ 1 min is in line, not a big deal

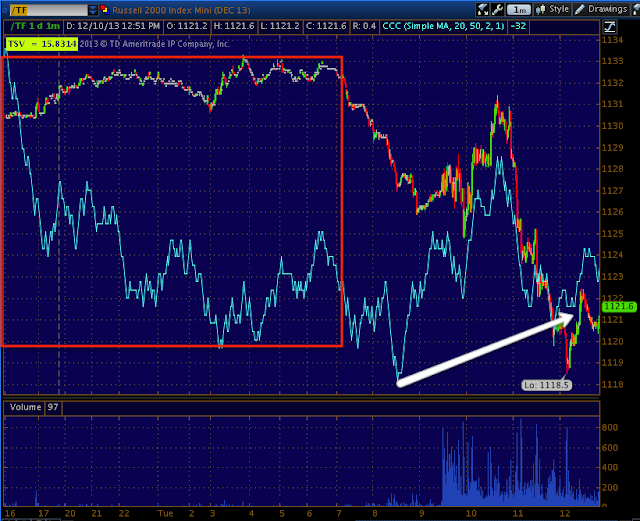
TF after having gone leading negative is now in a weaker relative positive 1 min chart.

The averages...
 1 min DIA positive-leading

IWM 1 min positive, one of the better looking in short term intraday underlying trade.

QQQ is in line here too after an earlier negative divegrence this morning, just like the NQ / NASDAQ 100 futures above.

 SPY 1 min relative/leading positive

Other indications...
 UVXY/VXX Short term VIX Futures, this is why I said I'd wait, but later today this may in fact be a long.

Negative divegrence (trades opposite the market).

HYG very small 1 min positive (relative which is weaker than a leading ) divergence

My Custom TICK Indicator vs the SPY, you can see TICK has improved to a neutral area from a negative trend.

More coming....Remember these are just 1 min intraday divergences

Quick Market Update

I'll follow this up with charts and a more complete update, for now 1 min charts suggest an intraday bounce, I was watching to see if it may be a new divergence over the possible Congressional budget deal that "could " be struck tomorrow, but it looks like it's just an intraday bounce for now.

Otherwise, signals remain negative.

Quick Market Update and High Yield Corp Credit (HYG)

Thus far the intraday charts for the averages are fairly well skewed to the bearish side, if there's an exception or at least an average with better 3C relative strength, it would be the IWM.

I'll update the market as soon as I get some cleaner signals in a couple of groups I'm looking at and as soon as I make sure we're not missing an opportunity here.

Yesterday I covered the manipulation of the market via algos following Arbitrage signals, a lot of that had to do with HYG (High Yield Corporate Bonds) as one of three assets that are modeled for the arbitrage opportunity.

I've said numerous times that this is usually a short term event and one of the reasons it is is because it takes money to move HYG, it may be a bargain for the bang they get in the averages, but if there's more willingness to sell in to that price strength or short in to it, then it starts getting a lot more expensive and this is partly why we've seen the levers of manipulation rotate so frequently, HYG is a practical lever as long as the VIX is low, with the VIX or VXX moving up, HYG no longer becomes a practical lever.

I was asked by a member why I said short term manipulation as it seems like they've been using HYG all year, that's sort of paraphrasing. The actual events are pretty short term, there are many through the year, but HYG is far, far from being in a healthy state and that is important because the credit markets are a lot better informed, thus the moniker, "Credit leads, stocks follow". I won't go through the mechanism of manipulation again as that was covered last night in the post linked above, but I do want to show you that HYG HAS NOT been used ALL year, just in places where they really need the help to get the market moving as the market doesn't have much more demand left even with record margin debt and record bullishness among retail.

As an aside, tonight I'm going to try to finish up a post on "Dark Pools", the misconceptions and how we actually benefit from them by not playing the game against them, but with them.

HYG...
 We started using HYG as a Leading Indicator and in multiple timeframes, this divergence in 2011 was very clear at the time, although by the standards of the size of the divergences today, this doesn't look like anything, at the time though it was a bright red flag telling us a nice move to the downside was coming.

HYG white vs SPX candlesticks.


Again in 2012 HYG divergences signalled another turning point for the market.

Now look at the size of the divegrence through 2013 compared to the last one in 2012 (chart above) to the far left of the chart at the red arrow, this is one of the divergences that is so stunning in its magnitude that it portends very bad things for this market, in my view, likely a secular bear in equities the likes of which we have never seen.

HYG has ZERO relative performance vs the SPX, In May Credit broke off badly from the market when we had the May 22 1-day key reversal.

Here we look on a closer basis, in green arrows I've highlighted where HYG has been used to help the market and where the market was at the time, as you can see, they are short term bursts that are not sustainable otherwise HYG would be tracking the SPX on this chart and the chart above this.

This shows the distribution that is solid through HYG.

This 5 min chart shows a few areas of HYG being used to help move the market, but a 5 min divergence is the smallest of institutional divergences and the distribution is always much heavier than accumulation.

Quite honestly, I'm shocked at the size of the divergence in HYG and I can only imagine what it's telling us about the future.

Gold Follow Up

Today's gap up in GLD is great momentum for call positions, it's a big move as well, +1.7%, in options land, you only get so many of those big momentum moves before expiration and I've been in the GLD position way too long and the Theta has eaten it alive. I have to make a decision, "Do I think there will be a similar move before the 21st without a pullback or gap fill because even if GLD ends up higher by the 21st, it's not like stocks, the Theta eats away every hour.

I decided there's a big enough chance because GLD in my view is coming out of a head fake move and the momentum opportunity is there so the one call position that's still pretty healthy and half of the one that is not is about as much exposure as I'm willing to take on that side of the equation.

The UGLD (3x long GLD) is meant as a trending, longer term position, but with that gap, I have to consider the probability of a pullback and I'd rather take the gains from opening the position just last week and re-openm it at a better price point.

 I'm going to give this a little time (hour or so) and see if there might be a better fill intraday.

This one I closed, the equity 3x long GLD.

As far as GLD, I love it, that's not the question though when dealing with options or leveraged products, if I'm long GLD itself, I'll sit through the draw down of a pullback, I think GLD and GDX are both going a lot higher, but leveraged products have a personality of their own as many of you know.

As far as the GLD charts now, strong with a decent chance for a gap fill, there's also a decent chance she keeps going, but I put a higher probability on a gap fill and the intraday chart is what I'll be watching to make any further decisions.
 The 60 min chart has a strong "W" base w/ the second half stronger than the first, below the red trendline is the head fake, it's big so the following move to the upside should have strong momentum.

The 10 min chart shows exactly where the head fake move was executed, distribution right above support, then huge accumulation as they buy lots of supply on the cheap.

The 5 min chart shows the same.

It's the intraday chart not confirming and leaving a big gap that I'm worried about. Seven years ago I'd call this a breakaway gap and be thrilled, but the market has been ruthless the last 4 years about filling gaps so the tip goes to a gap fill, but GLD still a very strong longer term position, IT'S ON A CORRECTION I WANT TO ADD BACK EXPOSURE TO GOLD.


Closing some Gold positions

There's an older GLD December $126 call that was down 90+% and not coming back, it's for the 21st expiration, today it's down 74% (of a spec. position size) which is a far sight better. I'm going to take some of my lumps there and take half that position off and free up some dry powder.

The more recent GLD December $126 (down about -30%) I'll hold, but I'm taking all of Friday's UGLD long equity off the table here, I'll look for a possible gap fill to re-establish it.


BIDU Trade Idea and Position Management Follow Up

BIDU, a long time favorite is a partial (intentional) core short position (trend trade), 1/3 size was entered, it's close to break-even, but I wanted to wait for a broader market move because of all the shorts lining up that needed that extra bump to the upside.

BIDU was recently brought out again as a trade set up, a trade that comes to us on our terms with excellent risk/reward properties, this is that post from last Friday which covers some of the larger history of BIDU and what we expected from there.

The very next trading day, this Monday, BIDU does exactly what we were looking for, here's yesterday's update dealing more specifically with the details of the trade idea and add-to.

Here are today's charts thus far as BIDU continues to behave as we'd expect, now it's all about timing to start or add to the partial position, I will be looking at bringing it to full size so that means adding the additional 2/3rds of a full position size.

 We were looking for a breakout/ False breakout (head fake) move from the "Bullish" Ascending triangle which is not there by coincidence as any first month technical trader would recognize the price pattern and what it implies.

This is why we were looking for the breakout that came the very next trading day, today it continues.

As I said Friday, it has to be convincing, just a move above resistance that triggers limit orders rarely does it, but they also tend to be in scale or proportional.

 The 30 min chart and many others were already leading negative before the breakout meaning the probabilities are/were VERY high that any breakout would be a failed (Bull trap) move, if I could only look at 3C once that last Friday and see this chart, I'd assign about a 95% chance that the breakout would be failed and I'd just be looking for the pivot to the reversal. The downside momentum starts when the triangle's former resistance (now support) is broken on the downside, the next momentum stage is just below under the triangle, so BIDU could fall very fast initially.

The yellow numbers are the stages, I didn't even have to draw the 3C divergences because they are that clear as the stages are: 1) base, 2) Mark-up, 3) top/distribution and "HF" the Head Fake move seen just before a major reversal and transition to stage 4 decline.

 The 10 min chart and some gas in the tank to the left to drive the move, but what is important is the leading negative divegrence at the breakout area.

Here we see it on a 5 min chart as well. From here I'm looking for more extreme signals.

The 5 min chart also clearly shows the management of BIDU with small demand9accumulation) and supply(distribution) that was used judiciously to create an ascending triangle, as I said Friday, "This triangle is not here by coincidence".

 So far intraday charts like 3 min look great, these are the ones that will migrate to longer charts and cause more severe signals and damage.

 This is the accumulation on a 1 min chart (small) just before yesterday's breakout and distribution in to the breakout immediately which is getting worse, PERFECT thus far, the trade is coming to us just as we planned.

You can see the 1 min is migrating to the 2 min.

When the signals are screaming it's time to move, more or less though that's myopic in looking for the best and most timely entry, truth be told, I don't think it will amount to more than a couple percent advantage which is not that much considering the big picture, what would be a shame is to miss the trade.

A.M. Observations

Lift by the Carry, Dive by the Carry.

As I said yesterday, I'm going with the probabilities and get ready to see some "unusual" things ahead.

Overnight I don't know what the catalyst was and often I think the notion of a catalyst is just a human construct so we can make sense of a seemingly senseless market at times.

Index Futures were lifted by JPY crosses and then they fell by JPY crosses.

 ES in purple vs EUR/JPY, I think it's pretty clear.

 This extreme, fast building leading negative on ES's 5 min chart is a bit odd and ES is moving below the lows for this week thus far.

On the 1 min ES chart an equally, but much less powerful leading positive so I'm guessing "Volatility Ahead".

Even though Gold and Treasuries no longer have the QE correlation, in fact the opposite, whenever a QE event comes up, they react as if they did have a QE correlation, but this morning T's are higher and Gold hit a 10-second circuit breaker when it popped higher $10 in 1 second. The $USDX is acting moderately like QE on like Gold and Treasury Futures, CLEARLY stocks are not.

This is what the correlation should look like, at least for gold.

/YG/gold 5 min futures, remember that buy on Friday, right on time...