Thursday, March 27, 2014

AAPL

Here's the AAPL charts that have been requested. On Monday I said I though AAPL looked terrible and that I wouldn't buy it, if I owned it I'd sell it.

There has been stunning improvement, but like the averages I showed in the last post, it's not about a nice foot print to bounce off, it's strong intraday divergences, but you can still only accumulate so much in a limited period, even if you dial up the accumulation so it's reading on longer charts intraday.

In my view, I'd probably still wait a bit to see if a wider footprint in this base area can be established, just because there are good probabilities doesn't mean they are great probabilities and just because you probably can trade it and do ok, doesn't mean it's the best decision.

 This is the AAPL 15 min chart just to remind you of what's on the other side of the charts below, this is only 1 of several very strong negatives, so if you do end up trading AAPL from the long side, keep in mind it's a trade, not a change in the primary trend.

AAPL 1 min

2 min

5 min

And all the way out to 10 min intraday, the problem for me is still the footprint size, I'm not going to enter anything I don't feel very comfortable with, even if I know the probabilities are that the asset is higher by Monday.


XLF, HYG, Market Update

I closed XLF Puts because it was easy to see they were losing momentum and easy to see there was a reason for that, a reason which may have some new trades opening up soon.

First here's the P/L for the April $23 XLF Puts just closed...


The 100 contracts had a cost basis of $.69 and they were filled at $1.06, so they came in right around a +55% gain which is fantastic for me, I', not using options to try to win the lotto, I use them to make what looks like a decent looking trade that may be lacking in profit potential worthwhile by using options' leverage. If I don't need the leverage, I prefer not to use it as it cuts both ways and you can only play with hand grenades so long before something unexpected happens.

There's been a lot of roatation this week from IWM to QQQ to SPY which it seems is now leaning toward SPY, that likely means Financials are going to outperform and we'll look at those charts.

If we decide to move forward with a long position it will almost certainly need leverage as the base that was there earlier in the week was pretty much trashed yesterday as it had never gained strength (the strongest divergences were 3 mins. and most only 2 mins.).

That means a SPY call might work, a UPRO (3x long SPX ETF) equity/ETF long could work, XLF calls might work or FAS (3x long Financials) might work if you prefer to stick with equities over options. I will look more closely at small caps (IWM) and Tech (QQQ) to see if there's anything stronger there than what we see below.

FIRST though...DON'T FORGET WHERE WE ARE...

 This 60 min chart of the SPY should clearly show massive distribution in a toppy environment, you don't get a much clearer signal than that. In fact, me drawing on it only distracts from how powerful it is so just to impress upon you the risk of taking longs...

Better yet, take a look at the stronger 2 hour chart (the 4 hour is even worse, but I think this gets the point across)...
SPY 2 hour leading negative divegrence art a new leading negative low in a flat , choppy, toppy stage 3 range.

Now as far as the lever to move the market, HYG has been getting slaughtered all week, it seems someone does want this market to bounce as they were working on earlier in the week, I still think it is VIX accumulation related, the market needs to bounce to send the VIX futures lower where they can be accumulated on the cheap-I've held this opinion for several weeks and nothing in price or 3C action has caused me to question it.

HYG 2 min all of the sudden is leading positive, this wasn't there yesterday so there's some attempt to engage the Credit/Risk on following algos to drive asset prices up.

The HYG 5 min chart is ugly, but there is a relative positive divegrence look at HYG's lower low vs the trend line and 3C's higher low, this is a mino divergence in the scheme of this chart, but it is a change toward the positive, even if it has no chance of changing the leading negative.

SPY, I like this one the most of the averages.
 1 min, YOU'LL NOTE IN ALL OF THE AVERAGES THERE'S A SYMMETRICAL TRIANGLE TODAY, THIS HAS NO DIRECTIONAL BIAS OTHER THAN THE PRECEDING TREND WHICH WAS DOWN.

The point being, traders see this and expect it to act as they've been taught for over a century and break to the downside once the triangle is finished because only the preceding trend gives a sym. triangle it's directional bias unlike the right angle ascending and descending consolidation/continuation triangles.

Do you see why this would be there, how it would set up a head fake move and a bounce? Traders expect it to break down, they will short it and when priceEs are run back above the lower trendline or the triangle's apex where all the shorts put their buy to cover stops, you get a mini short squeeze and momentum to the upside which longs will chase as we have figured out through StockTwits that it only takes 3 hours of price movement to change sentiment, TRADERS ARE JUST FOLLOWING PRICE, A LAGGING INDICATOR AND THAT'S HOW THEY GET IN TROUBLE IN A SITUATION LIKE A SYM TRIANGLE.

 2 MIN SPY, by now you should be seeing a pattern of migration starting.

3 min SPY, now you see even more, it seems yesterday's volume was a short term exhaustion/capitulation event.

Even the 5 min SPY is positive. The problem is the reversal process/ base is not very large, it may be the 5 min chart is engaged because they lost time and shares yesterday and are making up for it in quantity rather than quality or the time it takes to form a proper reversal process which would also explain the market wide sym. triangle if it is used as a head fake price pattern.

QQQ
 The 1 min isn't that impressive, but slightly leading

The 2 min isn't that impressive, but the 3 min looks better. I WILL look at AAPL because I know I'm going to get a slew of emails about AAPL any time I talk about the Q's making a move.

 This is the 3 min, there's a much clearer divergence, like I always say with using 3C, "If you don't see a clear trend, go out to the longer timeframes where there's less noise and more trend".

The 5 min QQQ chart is simply in line with price unlike the 5 min SPY.

IWM
 The IWM is my least favorite, this si the 2 min chart.

This is the 5 min chart, the 1 and 3 min aren't very interesting, but if they shape up, then having this 5 min in place will change dynamics and I'll like the IWM a lot more.

XLF-Financial Sector...
 1 min

2 min

3 min

5 min

Even 15 min...

You see why I closed the XLF puts? You see why I'm thinking about XLF calls possibly or FAS long for a bounce, not a swing trade, not a change in trend, a bounce!

More to come as I watch these charts and individual single stocks like BIDU.

Closing XLF April $23 Puts

I'm leaving FAZ longs in place. An update will be out shortly.

BIDU Core position follow up...

BIDU has been good to us the few times we have shorted it, we've had some of the best, textbook head fake moves in BIDU, in fact I often use our first short as an example of a textbook head fake move and how/why we let them come to us and what we look for (I remember well as I had a slew of new members all hot on buying BIDU when we had been stalking it for a short on a head fake move for several weeks... it turned out we did fantastic on the move considering where the market was at the time).

As a core short position in the tracking portfolio, I have room to add and I'd love to, thus far BIDU  has given us an +11.75% gain on a straight equity short (no leverage) which is what I prefer for a trade that has trend probabilities, they are so much easier, set them up and let them be.

I have been watching though and looking for a bounce to fill out the rest of the position which is maybe about 80% there.

Here's what we have...
 On a daily chart we have stage 1 base/accumulation, stage 2 Mark-up or what we'd usually call rally, then stage 3 distribution or top.

Note the BULLISH consolidation/CONTINUATION  Ascending Triangle which proceeds an uptrend, it's in the perfect place, it tells technical traders that BIDU's move to the upside is taking a break, but as the triangle matures and approaches its apex, the trend up will continue, thus "consolidation/continuation" price triangle. Volume was okay, but it should really decline as the pattern matures and as we reach the apex, a breakout when it's about 2/3rds complete is considered a very bullish event and right at the first orange arrow you see that breakout that was a head fake move or failed breakout, traders buy that move as they see it as confirmation of the triangle.

The first breakout also failed with a "Tweezer Top" resistance pair of candlesticks denoting strong resistance/distribution at the area.

The second breakout came as the triangle was complete, it too failed and it too failed on a "Tweezer Top" pair of candlesticks, again denoting resistance/distribution.

The second breakout is a perfect example of a head fake move and what it is suppose to do, note price just went straight down to break below the triangle's support after that, this is a function of the longs having stops hit and causing a snowball reaction of supply (#4).

At #5 we have ANOTHER move to the area of the Tweezer top resistance, this time a slight head fake move just above, just enough to trigger limit orders and that failed.

Right now at #6 we can see a daily hammer candlestick today, that's a bullish upside reversal, although it carries no target, but you can probably guess where a target might be based on the past. I'D TRADE BIDU LONG RIGHT NOW ON SOME CALLS AND THEN SHORT IT AS IT REACHED A HIGHER LEVEL ABOVE THE TRIANGLE AND FILL OUT MY CORE SHORT (I would not close the core short as it already has excellent positioning).

The problem is there aren't enough 3C signals that are strong enough, but there are other signals. If I didn't have 3C, I'd already be long BIDU for a quick piggy back or hitchhiking trade.

 This is a 50 bar exponential moving average on a 60 min chart, you can see it has been perfect resistance for BIDU during the downtrend. The recent dip lower is a change of character, if we drew a channel around BIDU instead, you might call this a channel buster and changes in character lead to changes in trends. Now I don't mean the primary short because the change in trend is really on a shorter scale. Volume also increased, yesterday I noted this market wide as looking like a mini "capitulation or exhaustion" event.


My Custom DeMark inspired Buy/Sell indicator has been right on as far as sell signals, I'm assuming its buy signal is going to work just as well, however I still need more evidence and it can come quickly.

 This is the daily 3C chart, you can see the stage 1 base/accumulation mentioned above, stage 2 confirmation/mark-up and stage 3 top/distribution on a strong daily chart leading negative divegrence.

I could show a lot of charts that tell us BIDU is a short overall, but if we can ride a bounce and enter a short or add to at higher levels, all the better, especially for new positions.

This 60 min 3C chart is an extreme leading negative divegrence and price just followed right along, that's why I call them leading, they lead price, but the actual 3C level vs price has nothing to do with the target, price reverting to the mean of 3C in what is confirmation usually tells us when we are at a target level and should tighten stops and start taking profits (3C'S NUMERICAL VALUES ARE IRRELEVANT), obviously we have a lot more downside over the coming months and perhaps even years with that daily negative.

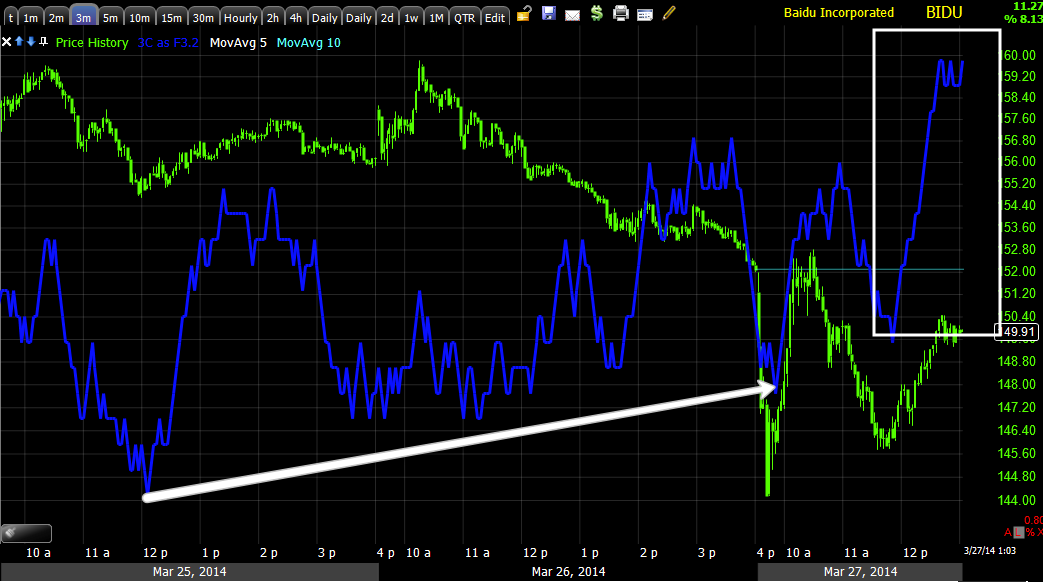
 Starting from the other end, 1 min we do have a positive at the capitulation event.

The 3 min has a leading positive

That's about as far as we go, we could get enough today to enter a position, but right now it's on the watchlist and does not have the confirmation needed for a high probability trade, but it does have good probabilities that it will become a high probability trade soon.

At the 10 min chart we can clearly see 3C is confirming the price trend nearly perfectly.

If this chart were to go positive, I'd definitely take out at least April calls, although I think you can get away with an equity long here if we hit the 10 min chart so BIDU is on the radar as well.

VXX Update

There's very little movement right now, once in a while underlying trade seems to stagnate, usually lasts a day or so, I'm not sure if that's what's going on or it's just kind of dead right now.

In any case with VXX it looks like some intraday downside is going to be seen, not enough right now any way that I would trade it, but it will be interesting to see if VIX futures finally start to underperform their correlation with the market which they have outperformed more or less since about February 7th. That outperformance is what has held them out of the accumulation range lower, but as mentioned earlier reports from members saying the forward and second month contracts were falling at double digit percentages today was certainly an interesting development considering the market environment, tone and perception.

 Intraday VXX 1 min negative.

3 min intraday negative

5 min positive yesterday and intraday negative on an important timeframe.

 The overall 5 min leading positive.

I'd like to see VXX come down to at least the $41.50 level, this so it can be accumulated, bought and give us a good signal on when a strong move is on deck for the market (down).

This is the daily VIX futures VWAP, you can see it has just been bouncing around within the standard deviation channels, there doesn't seem to be any pattern here, 3C's intraday is the closest thing showing some distribution along the lines of steering current timeframes except for the 5 min, but VXX has been so stubbornly persistently strong vs its correlation, perhaps it needs some heavier steering divergences.

In Line (mostly)

After a downdraft like yesterday we "may" close higher, but we aren't going to make a "V" turn higher, there will have to be a reversal process "if" that's to happen.

I should have stuck to my initial plans (likely, I guess we'll find out) and not let go of the SRTY (3x short IWM) position yesterday as I was closing it in to SRTY strength as I usually prefer to do. I still have plenty of short exposure even in the trading portfolio, SQQQ, etc.

There are some other assets that may be of more interest earlier today and that's what I'm going through now as well as trying to understand what is going on with the market, VIX, SPX puts, etc. It seems to me they've had a real hard time knocking VXX down, so those puts may have been a way to try to do that and with premiums collapsing earlier, maybe they've found another lever.

In any case, I COULDN'T close the XLF Put which normally I would in to weakness and it's up another +20% at least this morning to a +50% gain.

The XLF charts may not be an exact proxy for the market, but they should show we have time and in that way act as a proxy for the market, here's why...
 The 1 min XLF chart "could" be a relative positive divegrence and thus be starting the reversal process which could take half a day or a day and a half, it's hard to say and it's hard to say if this is just coincidence at this point as there's no migration , at least not yet. For example (and many charts are in similar situations among the averages)...

 This 2 min could reflect a pretty decent positive divegrence , but until 3C turns up and locks in the divergence, it could just be lagging price a bit which happens in a fast moving market, we will see shortly.

 THIS IS EXACTLY WHY I COULD NOT LET GO OF THE XLF PUTS YESTERDAY OR THE FAZ LONG.

THIS IS THE SAME 5 MIN CHART FOR FAZ, these are totally disassociated as far as volume, asset class, etc, there wouldn't be a divergence like this unless there was a true divergence like this meaning this is real.

CREDIT...
 EVEN THOUGH MOST OF THE EARLY PART OF THE WEEK WE WERE BUILDING POSITIVES, I MENTIONED OVER AND OVER THAT THE LEVER THAT SUPPORTS THE MARKET WHEN IT CAN'T SUPPORT ITSELF IS HYG AND THAT HYG HAS BEEN UNDER DISTRIBUTION ALL WEEK DESPITE GAPPING HIGHER AND BRINGING THE MARKET WITH IT FOR 4-DAYS IN A ROW.

 Here's the 5 min HYG chart for the last week or so, they've tried to push the market using this lever, but it seems there's a lot of fear and they don't even want to hold a small manipulative position, but rather take any opportunity they can to sell price strength in High Yield Corporate Credit.

This was the dichotomy this week and it was only a matter of time before one would tip the balance, possibly those puts yesterday were the straw that broke this camel's back, but we still don't know EXACTLY why they are there.

If it were me, unless I knew the market was going to crash tomorrow morning, I would not buy $200 million in May 1995 puts over a few hours, that's a tell, that's showing your cards and I find Wall St. will show you their cards IF they want you to see them, in other words, if you watched the Cramer video, they'll show you a transaction like that if they want you to react to it, if they are really trying to gather a position like that, the last thing they want is for you to know about it and try to piggy back them causing them to pay more for their position AND HAVING NO ONE ON THE OTHER SIDE TO TRADE AGAINST.


Trade Idea Equity Long ETF: FXP

FXP is a non-leveraged China 25 short or simply a way to short China, I've been looking for an opening here all of 2014 and until recently there was no decent one. I think I've put this out 4 or 5 times already so this is a reiteration as I really do like it for a long position for short exposure on China.

If anything substantial changes for the better or worse I'll update it again.

As of now it's still in good buying position in my view as it finishes up the reversal process.

 FXP Daily chart with the first break of the trendline for 2014 on hopes of Chinese stimulus from the PBoC as they continue to drain money out of the system via repos.

 15 min chart and the reversal process, yesterday's entry is similar to where we are today.

The 5 min chart showing today's action in the same area is still on track and overall...

A clean 15 min positive divgerence

Everything is not what it seems

There's been quite a bit made about yesterday's 15,450 SPX put contracts bought yesterday from 11:57 a.m.-1:12 p.m. in chunks for about $200 million in options premium, of course a put is a bearish bet, the amount of stock that controls is roughly $2.9 billion and CNBC has suggested this is what spooked the market, but options are a tricky thing and blatant trades like that are not always what they seem.

I have also received reports this morning that VIX options that have been holding their premium well are seeing double digit declines in their premium this morning for the forward month and May, which is interesting, on one hand a very VISIBLE bearish options play and on the other VIX premiums dropping hard.

I would just caution not to assume too much about the options as there are dozens upon dozens of reasons someone might open a position like that which doesn't jive with what you'd assume they opened it for, it could be a totally different reason than a bearish bet. 

For instance, if you haven't seen it already, listen to what Cramer says in this video (one of the only ones I can watch and one everyone should watch) from the Street.com) about how he would use options to create a lie to create a new reality, in short they were used to give the market an impression that was not actually fact, it was manipulation.

THIS VIDEO is dated, but listen to what he says about AAPL, this was before the first I-Phone launch, you'll see how common this manipulation is.

Otherwise we had a 5th day of pump and dump, a little different theme today as ES futures were run up overnight to be dumped pre-market...
ES pumped overnight and dumped with 3C showing distribution before the dump and this was earlier this morning, on the open we have a knee jerk ramp that has confirmation so far.

30 Year Treasuries were bid as well, a Flight to Safety? The only thing is I see some distribution in them and have since yesterday, not a short in my view as of yet, but with the 30 year up and 5 year down it's forming a bear flattener.

China on their regularly scheduled policy action overnight (Tuesday and Thursday) withdrew more liquidity from the system, in fact almost twice as much as last week at $98 bn CNY vs 48 bn CNY last week using repos, so the Chinese stimulus that the market was all worked up about this week and gave us a pullback in FXP (thankfully) again seems to be a pipe-dream imagined up by the market as the PBoC has been clear in saying, "Don't expect stimulus", however the CREDIT situation is getting worse and worse there which we'll look at later, I'm just glad to be long FXP finally.

Initial Claims beat and pretty well and GDP missed for the final 4th quarter revision for 2013.

I'll have an update for you, but I'm interested in what's going on, it seems the market is being gamed and the pundits are blaming it on non-sense.

For instance, the Q's which looked horrible yesterday vs the other averages, even before the dump, now look pretty darn good as they held up (underlying trade) during the dump leaving us with a 5 min relative positive and a head fake move in place.
QQQ 5 min relative positive, much larger than before and finally on a respectable timeframe.

Gold and GDX are likely on deck today so get those on your quote screens.

I have some digging to do