Tuesday, May 6, 2014

TICK Charts

These are a great place for early trend change information.


Note the downtrend as we had a lateral trend earlier, to the far right you can see the number of NYSE stocks advancing less the number of NYSE stocks declining is shifting to a less bearish stance and moving out of the channel.

Market Update

So far we have good confirmation on the move down which is good, we don't want to chase the market though.

I do see some things in the NYSE TICK just starting to develop that would suggest we are going to slow on the downside momentum and possibly see a bounce along the lines of what I just suggested in AAPL.

This is very early, but it's a good place to look for early signals and there are some 3C signals that ARE NOT positive right now, but they are moving in such fashion that they could go intraday positive very quickly.

This would be a fantastic set up for us.


AAPL Update

If you caught yesterday's AAPL Update then you know that the charts from 10-min to 60 min (actually daily) are all negative, all set to go, as of yesterday it was just the 1-5 min charts, thus far today there has been deterioration in those charts, I'd hate to chase AAPL and the 5 min chart suggests we might not have to.

 The 1 min chart's trend is out of sync and in leading negative position, I'll be watching it though for any hint of a small positive for a bounce, I'll show you why.

The 2 min chart has seen migration from the 1 min, it is similar, but the divergence is not as sharp.

 The 3 min has a nice negative divegrence going, but it could be stronger. This is where I have a line in the sand, the 5 min charts.

This one is still in line, yesterday's post was looking for the 1-5 min charts to look as bad as the 10-60 min charts posted yesterday or the chart below...

AAPL 10 min, heavy distribution in to the earning's gap.

I suspect with the 5 min chart still in line, AAPL will bounce and the 1-5 min charts will deteriorate to the point AAPL is a clear short set up/ entry.

VXX Update

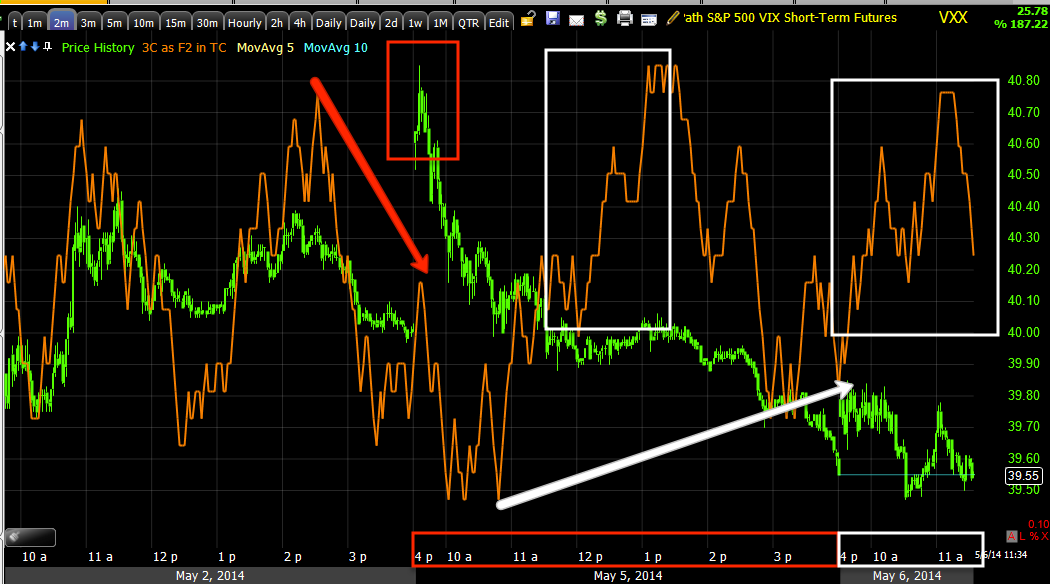
I've been wondering what's going on with VXX, right now all the intraday charts are looking fantastic as they add to yesterday's accumulation of the smash of VIX lower.

Charts to follow

Financials (XLF) & FAZ (long) Update

***Sorry about the delay, this post took an exceptional amount of time to upload the charts***


I wanted to get this XLF post out last night, but it was almost 11 p.m. by the time I stopped working to get something to eat so here it is now.

FAZ is a full size long position in the trading tracking portfolio, it's down 1% on the position which is fine.

I really like what I see in XLF and FAZ, the only chart that is not giving me good confirmation or signals is the 2 min chart, which is kind of not surprising given intraday trade has been very "blah" and of course very choppy market wide going on the 6th day now, really since about the 22nd, the 11-15th was the best entry and we had many there as well as forecasted targets as a reversal was VERY clear in the charts and the best time in my view to exit the market or those trades was the 22nd, since then it has been a meat grinder as we wait for confirmation of the next cycle pivot.

 This is the SPY and now the 6th consecutive day of meat grinding chop. The yellow arrows just point out how failed moves become fast reversals, the whole head fake concept.

 As far as real 3C signals to enter cycles, we knew by the 11th and were closing shorts/puts and opening longs/calls, the 22nd would have been about the best place to exit if you are trying to stick with any kind of trend trading, other than a couple of days, everything has been very flat.

As for XLF...
This is the intraday chart, in line and slightly leading negative

The 2 min I skipped as I said, no confirmation there, but actually it's in line with price now.

 This 3 min  has some strong negatives at pivot highs, there's a question in my mind as to whether this 3 min chart can form a relative positive divergence or is just catching down like the 2 min chart just did?

If it did, it may give a decent entry for XLF shorts/FAZ longs on an intraday basis.

The 5 min chart and the cycle from the 11/15th which I'd say ended any trend other than choppy lateral around the 23rd/24th, There was a recent head fake in yellow and a leading negative with price following it after the head fake failed move.

The 10 min chart cleans up the 11/15th trend , stage 1 base and clearly illustrates the exit around 22-24th, since then nothing but a uglier leading negative divegrence thus it seems fairly plain that we are on the edge of stage 3 top area and the downside pivot that should move 3 different trends all to or back to stage 4 decline.

The 15 min chart catches the February cycle too, this is the larger one , XLF like many assets went leading negative before stage 2 was even halfway through.

As you see, XLF has also made the transition to stage 4 and the volatility shakeout back above former resistance, now support, but the area that defines the stages 3 and 4.

The 30 min chart is confirming signals from the 15 min chart perfectly. Financials do appear to be in significant trouble as mentioned earlier about April 30th Window Dressing with banks borrowing from the F_E_D for 1 day to dress windows and plug or fill capital short-falls for the month end report.

The 60 min chart should make the February cycles resolution of highest probability VERY CLEAR.


FAZ-3x short Financials
 FAZ 60 min confirmation

15 min confirmation leading positive

The bull pennant/flag in FAZ...

Accumulation of that area on a 10 min chart.

And most recently on a 3 min chart.

FAZ is an absolute hold in my view and an add to or new position if you get the chance on a counter trend pullback in FAZ.

A.M. Indications

It's another fairly blah market in breadth and some underlying trade although price is not as blah with all of the majors in the red by at least half a percent to nearly 1% (.90-ish) (at the time of starting this post).


Here's what things look like so far, not really exciting, but some insights.
 ES intraday had a 1 min positive at the early lows right after the open, it couldn't capitalize off it much at all and now we are close to in line again.

The NASDAQ 100 futures 1 min had the same divergence right after the open, there's a small leading positive to the far right, I think this has more to do with AAPL than anything else at this point.

 Russell 2000 Futures going negative several times overnight, but largely in line with the losses and still in line right now, no positive activity at all unlike NQ futures above.


 This is the 5 min VIX Futures I mentioned earlier this morning, note the positive divegrence started as the VIX was initially slammed lower at regular hours open and continued to move higher, these do not trade 24 hours, only a few minutes out of normal market hours so most of this divergence is regular hours.

This is today's NYSE TICK Data, it's almost trendless, except "Lateral" or sideways is a trend and it's in the +/-750 region the entire morning, nothing of any significant breadth, a little wider than parts of yesterday, but no huge moves in breadth.

 My custom TICK Indicator shows the same, you see yesterday's move up and then the decline in breadth as we also saw negative divergences in the averages in the same area and positives in VIX futures.

 SPY 1 min going negative in the afternoon as I mentioned above as well as the early a.m. positive today that went no where and right now totally in line with price.

 The SPY 2 min shows another cycle I didn't mention earlier, it's a much smaller one, buy obvious as the chart leads negative and looks to be rolling over which could kick start the smaller cycle posted earlier today and the larger February cycle's transition BACK to stage 4 as every average entered it before a VT shakeout.

 SPY 60 min w/ the Feb. cycle leading negative, the red "4" is stage 4, the yellow arrow is the volatility shakeout we always see right after a move to stage 4, we see it a lot in H&S tops as well as clear stage 3 ranges like this one.

The pivot to the downside would be returning to stage 4 and thus should make a lower low, not just a pullback and for the NDX/QQQ, that would be significant.

 IWM intraday, it looks just like the IWM futures, in line with the move down.

IWM 2 min has some divergences in the trend, but the theme is in line

 The QQQ is nearly perfectly in line right now intraday , similar to the NDX futures, except they were moving positive and since have moved more in that direction, again I think this is the reason.

 AAPL intraday with a lot of inline activity, but a current positive divegrence intraday only, the trend view is located in a leading negative position.

Remember this is one that should come to us.

VXX 2 min from the initial distribution on the open yesterday to slam the VIX to the accumulation of lower prices.

This is the USD/JPY which ES has been tracking very well

And the EUR/JPY which ES has also been tracking fairly well

 USD/HPY 1 min (red/green) vs ES (purple), you can see the tight correlation.

 I suspected that the USD/JPY would head higher because of this $USDX positive divegrence

 The Euro has a negative that was in place since earlier so I'm not feeling strongly about that right now.

However, when I had that impression of the USD/JPY heading higher with the $USD positive divergence, the Yen had a negative divegrence at the time that made sense, it has since resolved to in line with a 3C move higher, it's hard to say now because a rising Yen keeps the USD/JPY moving lower and a rising $USD moves the USD/JPY higher and right now they are both at odds, that may be why there's such stale activity.

Quick VXX Update

Yesterday the VIX was purposefully slammed to try to push the market higher, this is what we'd call, short term or intraday manipulation or a lever, it rarely has the power to change a developed base, it's just intraday manipulation and it's quite clear, I think the reason is probably quite clear as well when you look at AAPL yesterday and the volume at exactly $600.

Here's a quick look at some of the charts for activity relating to yesterday's VIX slam...
 This is the SPY in green vs. the VXX in red, I should have captured this on my other platform and inverted SPY's price so you can see how out of whack the correlation was, a clear VIX slam to try to help the market as VXX was WAY below the normal correlation between the two assets.

However in the yellow box at the end of the trading day as we noticed a change in character in some 3C charts that had been "blah" all afternoon Market Starting to Reveal More About Intraday Trade, you can see that additional slamming of VIX futures did nothing to move the market higher, this is when the negative divergences formed that are referenced in the link just above from yesterday afternoon.

 This is the trend view of the 1 min VXX chart just for perspective and  the reversal process, interesting that the lest "assumed" head fake move really wasn't that much of a move as it really fits pretty neatly in to the rounding process, but yesterday is a bit different and more along the lines of the location of a head fake move (near the end of the process).

This is a close up of the 1 min chart to see the intraday action, right off the open there was clear distribution, not heavy mind you because we are looking at a 1-min chart, but this is also the timeframe we use to monitor intraday trends and reversals.

Note the in-line status of the early afternoon and as 3C signals improved from "transitional" to negative in the SPY and IWM (the Q's stayed in line for obvious reasons being AAPL has about as much weight as the bottom 50 NASDAQ 100 components combined at last report...being NASDAQ's weighting is proprietary and costs $10k a year for a subscription to find out) and around the same time VXX is showing a positive divergence.


 There was migration as well as you can see on this 2 min chart

And right on out to the 5 min chart which is not  shown in full perspective, but a closer view to see the trend and action more clearly.

Also interesting was the VIX futures themselves on a 5 min chart... They were and are leading positive, so it seems the slam down of the VIX served dual purposes, one was to support the market and two I would venture to say formed a head fake move, I can't say which of the two were more important, however looking at the EOD tape and VIX (first chart) and the fact that the slam couldn't move the market even as AAPL broke $600, I suspect the more important reason may have been the second reason.

Pre-Market Futures

Pre-Market Index futures are taking a pretty good beating, as early yesterday it could be blamed on the Ukraine conflict, but as we saw after the open, the market wasn't thinking about Ukraine. It could be blamed on stronger than expected Service PMI's out of Spain, Italy and France with Spain's coming in at a 7 year high, perhaps a new excuse to stay Draghi's hand from any additional easing and perhaps that's to blame as the EUR/USD takes off like a rocket and the USD/JPY fall like a rock.

 USD/JPY with a slight relative positive divegrence, we'll see if it gets run over, but there are negative divergences in both Euro and Yen single currency futures and a positive divegrence in the $USDX, so perhaps this positive divergence just starting will get some legs.

As you can see ES (purple) is now tracking the USD/JPY, apparently the algos caught on and are following the pair, ...however...

 As bad as ES looks on this 1 min chart with the "start" of a positive divegrence, it's not well formed at all yet, we could think of a lot of things to blame, how about Barclay's dismal trading revenues reported in earnings today? Down 41% for Q1!!

From the Wall Street Journal:

"
Revenue fell 41% in Barclays's fixed income, currencies and commodities division, typically its biggest earner, in the first quarter, halving the investment bank's operating profit. It was an even bigger fall than analysts had expected and compared with roughly 20% declines at rivals which have also seen clients pull back from bond trading because of persistently low and stable interest rates.
Barclays executives are now trying to get the business in shape to cope with the slowdown and new banking rules, as part of a broader restructuring to shed thousands of jobs and improve returns across the bank. Chief Executive Antony Jenkins said his new strategy Thursday "will address issues underlying the performance challenges we have recently experienced, including positioning the investment bank for the new operating and regulatory environment."
The lender's CEO is launching a new strategy for its investment bank as a string of its top executives and deal makers are departing, raising fears that clients could take their business elsewhere if the exodus continues. Mr. Jenkins has also been under attack from investors for raising bonuses at the investment bank last year despite a fall in revenue and profit, adding to pressure for him to clarify his plans for the unit."

I have mentioned recently the F_E_D's fixed rate Reverse Repo (1-sday) on April 30th over 200 bn , the second highest ever, all so banks could fill capital shortfalls to fool investors and regulators, TRULY to Window Dress and make themselves look stronger than they are, if even for a day, but that day was the end of the month reporting period.

However, the truth is, that deterioration we saw late yesterday and in to futures last night...Market Starting to Reveal More About Intraday Trade and Futures Update can be seen below through the late afternoon regular hours and the entire overnight session...


5 min ES

So perhaps it's just the fact we are at end stage Stage 3 in at least 2 different cycles, 1 major (February Cycle for all averages except NDX which already retraced it) and the other minor (the April 15th cycle).

The two cycles in play, both in late stage 3...we shall see.