Tuesday, September 30, 2014

Promised SQQQ Analysis

In this post I'm comparing the underlying, QQQ or NASDAQ 100 to the 3x leveraged ETFs, both long (TQQQ) and short (SQQQ), I am personally holding SQQQ along with SRTY (3x short IWM).

I have found over the years, quite often the leveraged ETFs will give signals sooner or stronger than the underlying, which I would assume is a function of the need to move faster because of the 3x leverage.

When I look at SQQQ's chart (I only included 9 as I didn't want this post to go on forever), I can't see a reason not to own it, even right here without a pullback and better entry, the overall position over a period of several months I would think would be lucrative enough that a few percent here or there on the entry would pale in comparison to missing the position, which is why, despite my desire to get some swing trades going "if" the signals make the risk/reward worthwhile, I'd still be loathe to give up what I consider to be a longer term trending position on the overall market that I intend to hold for some time.

*By the way, to the best of my knowledge, regulations just increased 3x leveraged ETF margin maintenance to 85% last week, so someone is expecting volatility ahead at the regulator level which makes sense considering NYSE margin debt and investor net worth (ability to meet margin calls).

Here are the charts, QQQ will be first in each timeframe followed by the 3x long, TQQQ which should look similar to QQQ, although you might notice signals are earlier or sharper and then SQQQ, the 3x short QQQ ETF which should look like the mirror opposite.

 QQQ 2 hour leading negative through stage 3 of the August cycle and the head fake move (yellow)

TQQQ 2 hour, essentially the same, note the strong 3C distribution through the large Stage 3 top and the head fake move.

SQQQ (3x short QQQ) with a strong leading positive divegrence as QQQ was at stage 2 as well as higher leading positive divergences since the head fake move in the broader market.

 QQQ 60 min going negative at stage 3 and worse at the head fake move.

TQQQ 60 min looking even worse.

However SQQQ has an amazing 60 min leading positive divegrence.

When I talk about looking for divergences, although we try to interpret whatever asset we are looking at,  these are the kinds of signals that shouldn't be ignored, these are the ones I call, "Jumping off the chart".

 30 min QQQ sharply leading negative since the market's head fake move.

TQQQ 30 min

And SQQQ 30 min. Even as we have seen some lower prices in SQQQ at certain areas, the divergence has been strong and growing. I believe these are not typical retail and these are strong hand shorts that aren't easily shaken out by new high headlines or strong 1-day moves that spook retail traders.

I can't see any good reason not to have exposure here to SQQQ long on a long term basis, although I like it a lot as a swing trade at the right areas as well, I'd just rather let this work for a year or so and I think we'll be very happy.

THE PROVE IT TO ME TRADE...

I think I've been pretty clear on the "week Ahead" (this week) and so far what we've seen this week, although I'll admit freely the fact we have Window Dressing and the end of the quarter today, does leave some question marks as to what certain signals actually mean when they'd otherwise be pretty clear as there's obviously a higher probability for  more than one motive until today's close.

SRTY has been doing excellent for me so when we saw the stage 3 top for the August cycle and predicted (as is the norm for this situation) a head fake move up with distribution in to it and then the market following HYG to stage 4 decline, it takes a pretty good deal of evidence to step away from a position like SRTY when the trend since the head fake move, typically the last thing we see in stage 3 before a stage 4 decline, looks like this...

 SPY stage 3 top followed by the transitional head fake move, a failed breakout and stage 4 decline with a series of lower highs and lower lows, or a downtrend which is of course the trend expected in stage 4 decline.

The IWM has an even longer trend to the downside, so obviously at this point, anything on the long side has to prove itself.

I started this post before the market started heading down just after 1 p.m. in anticipation of such an event as signals were pointing in that direction so some of these charts are going to be redundant now that we know their signals were correct, but the bigger point is still valid.

In Index Futures...
 The 5 min futures usually need a positive divegrence before I'd consider any long trade, but this may be about more than just a long swing trade, it could be about the entries in certain assets, FSLR is one I'm looking at closely for a fill out position as it has performed well on the partial and really only needs a little bounce for a good entry, AAPL fill-out is another and on and on. The other possibility is the pinning of the market because it may indeed just be that weak that the best close they can get for the quarter is right here and whatever support from 3C this week, has been to just hold the market in place to prevent a lower Q3 close, some evidence in market breadth is suggestive of that possibility, although it would be one of the largest consolidation divergences I have seen, which would make sense considering how bad the market looks on an continuing basis.

Again, there may be more than 1 motivation here or an unusual, unexpected one due to the end of quarter.

I was pointing out with this chart that the SPY is likely to see some lower movement today, it has already done that as I was uploading the charts,  this is what I wanted to see since yesterday because any accumulation to strengthen a divergence (positive) and lead us to a post Q3 corrective bounce, needs a stronger base than what it has now which requires price to come down, so that was the point in this chart's negative divegrence, the white trendline being the rough area of where ES/SPX futures would need to be.


I was pointing out the same in Russell 2000 futures.

  And I was pointing out the same in the NASDAQ 100 Futures 5 min chart, their negative divegrence suggested a move lower to the trendline.

The 3C indicator would need to make higher highs as price makes lower moves toward those trendlines, none have met that lower target as of this moment.

 The 15 min ES/SPX futures chart is just showing there's no positive, there may be a slight negative relative divegrence between points "A" and "B", otherwise distribution signals have been clear and solid forecasting.

 ES/SPX 30 min is in line with the downtrend.

 As is TF/Russell 2000 60 min, but there's the opportunity for a positive divegrence, although there's really not anything special there yet, but it wouldn't take much for the market to prove it to us before price even made a move.


 Again with the QQQ intraday 1 min I was just pointing out the intraday distribution at highs and the probability of lower prices coming shortly.


 On the QQQ 15 min chart I'm pointing out the same right now, but also the opportunity that such a move could  create toward the lower trendline  because the current base which essentially is only the white trendline, is not enough to do much other than hold price in place or maybe a slight bounce.

In other words, as we sit right now,  this divegrence is not a "NEW" opportunity creator, however it could be confirmation for existing shorts if the improvement doesn't show up.

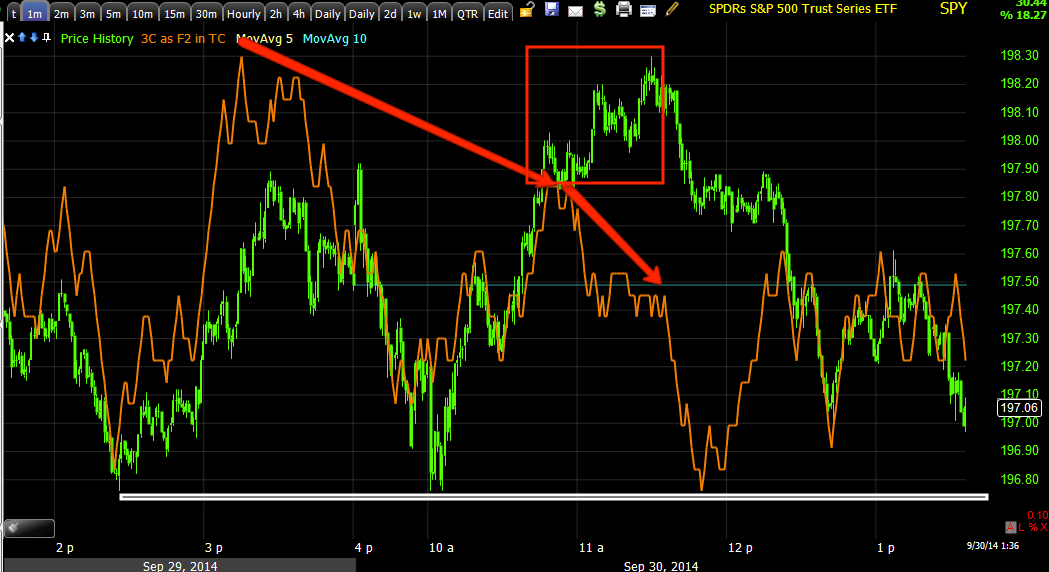
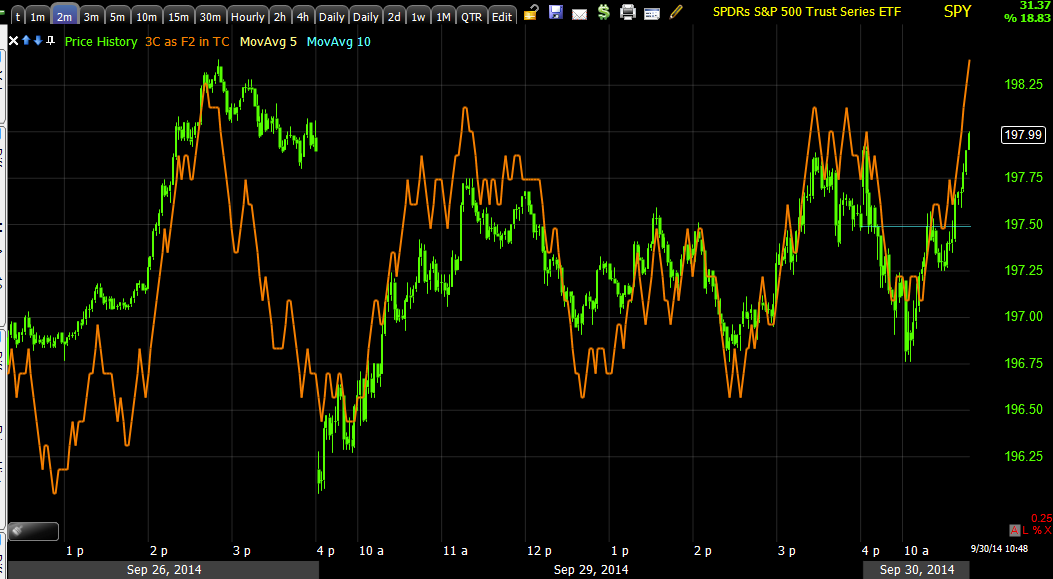
 The SPY intraday is also showing a negative intraday divergence which pointed toward lower prices, which are still being made as I write.

 This is the SPY 15 min chart, it's divegrence area and what would be most useful, the green arrow representing price below or around the trendline (white) while the 3C chart moves like the orange arrow.

The yellow arrow is the new low expected early / Monday of this week.

The Custom TICK failed pretty quick intraday today.

Here's where it gets interesting... HYG has been used as market support, however, things are changing...
 This is an intraday 1 min HYG chart, these flat ranges look boring, but they tend to have the most underlying action, in this case, distribution. Remember HYG's 3 min leading positive divgerence sent it higher as market support or a short term manipulation lever as it has been for months, even years.

 Interestingly, this doesn't look like a fluke as there's migration of the negative divegrence intraday to the 2 min chart.

 While this 3 min HYG chart's 3 min positive is what we have been looking at, on an intraday basis, and this is how all new divergences start ...

The 3 min chart on an intraday basis is seeing the same migration of the divergence, negative, which means it's getting stronger.

Again this makes me question motivations as this is happening in to the last few hours of Q3.

 Our custom SPX/RUT Ratio Indicator has given out, not horribly, but it too was calling for lower intraday prices.

And High Yield Credit...
is not looking good.

The only other two leading indicators of interest at the moment are professional sentiment, are slightly positive in to the decline since 1, however not anything so strong as to be worth a screen capture.

The market is near the area where it CAN prove itself, or it can fail badly,  the timing we predicted for the week ahead was Wednesday, the first of the month so this would be the time to do it or darn close.

I also want to get an SRTY and especially SQQQ chart up, you'll see what I mean about the shorts being strong hands with weak hands shaken out as well as how incredible these two 3x inverse ETFS (IWM and QQQ) really look.

Market / XLF Update

I've run through the watchlist of interesting stocks lighting up green today just to see if there's anything that's looking interesting as well as checking some of the under performers and the averages which you've already seen several updates.

Considering Friday's Week Ahead and Daily Wrap, I guess I shouldn't be surprised, we were looking for early weakness Monday likely making a new low since the head fake move of 9/15-9/19.

The anticipation was for a probable post Q3 Window Dressing bounce, the theory behind that is all of the under-performers which are significant if you recall the number of NASDAQ Composite and Russell 2000 stocks that are already in technical bear markets,  a lot of small and mid-caps, will likely be picked up on a post window dressing oversold condition as those are the stocks managers want to get out of their portfolio before the end of the quarter as what they hold as of the end of today is what goes in to their filings, prospectus, etc, the Art of Looking Smart.

Since yesterday, it seems to me that a best attempt for the best close of the quarter has been likely, but you have to consider that and what can and can't be bought in order not to mess up window dressing which is typically about the last week of the quarter or so.

This sideways chop from yesterday and today is just like being stuck in mud, however, stick ing with the original theme for the week, a post Q3 (today) bounce on that oversold stock basis because of Window Dressing, I am seeing a couple of interesting things in a lot of stocks and XLF is as good an example as any for what that is, HYG is also playing an important role here as this is used, as you know on short term moves to help the market and it leads the market as it has been doing for years, but exceptionally well since July.

As posted yesterday, HYG's divegrence is interesting that it shows up here given expectations in the week ahead post...
 HYG's 3 min positive, the first hint was the turn lateral and the leading positive divegrence, although this is only a 3 min divergence, it's enough for a short term bounce like I proposed Friday for post Q3 which ends today, I suspected tomorrow perhaps we'd get a bounce.

HYG is not only showing a 3C divergence which the market cares nothing about as it knows nothing about it, but the push higher in HYG is the key to it being used as a lever as it is a leading indicator because it's used so often as a lever and because of it's longer term repercussions on the market, so today's move and the divegrence there are interesting.

Yet the market is like being caught in mud the last 2 days, again post Q3 corrective bounce?

It's important to note that the HYG divegrence stops at the 3 min chart, a 5 min divegrence would be significantly stronger, but it's not there, it's in line at best, so the degree of support HYG is aligned to give is along the lines of the kind of corrective bounce which as you know in my opinion is based largely on the number of stocks sold off in Window Dressing to get those ugly performers out of the portfolio holdings, at least it will appear that way, as the reported holdings are as of the close today.

XLF as a broad market proxy (Financials)...

Like the averages, there's a lot of damage since the August cycle which is what we are looking at on a 60 min chart, that leading negative divegrence on such a strong chart is not a good sign for the market, especially as it shows up strongest at the head fake move anticipated as the August cycle was rolling over in to a stage 3 top.

The point simply being, the broad weakness across HYG's longer chart, 3C charts, market breadth, etc. is the dominant theme.

 However looking at XLF on a 5 min chart we have a decent positive divegrence after the distribution at the head fake area for the major averages. This is what I suspect is the post Q3 divergence which could use a drop in price back toward this week's lows and allow for 1 more round of accumulation, at which point there might be signals of high enough quality, that some swing trades can be established, right now I'm loathe to let go of short positions that are making money every day to try to trade around this with a so-so divegrence,  but I desperately would like to get a decent swing trade going and get out of this lateral muck.

 XLS's 3 min chart is just posted as verification of the migration of the divergence, confirmation. There's enough here to bounce, the question is, "Is there enough to make the bounce worthwhile and trustworthy enough to hold without seeing immediate distribution and collapsing early?"

This is all about the Risk vs. the Reward.


 Intraday, this is the kind of muck I'm talking about over the last two days, in line or on either side of that with slight positives or slight negative, almost  like steering divergences meant to keep an asset in a range, although I'd think they'd want the best close out on the quarter.

The 1 min intraday chart is the same and this is a proxy for just about everything I'm seeing.
These intraday charts aren't good signals to trade and luckily so as this is a sand trap with all of the lateral chop, but once we get to 5, 10 and 15 min charts, we have decent positive divergences, you saw what the last 15 min positive in the QQQ did, it was a lower high in the Q'd downtrend since the head fake move.

Again, same as yesterday, this is not about the probable direction by tomorrow or in to tomorrow, it's about quality.  I will enter a swing position if I feel the reward is worth the risk. Right now, I don't see that and would rather just keep shorts like SRTY, SQQQ, FAZ in place and let them work.

MARKET UPDATE

Basically the market is working off the gas in the tank we looked at yesterday, the 10-15 min divergences, there's a pretty decent example of about what that's worth...

To the left is a slightly bigger 15 min QQQ positive divegrence, you can see it was worth about a corrective bounce creating a lower high, I suspect that's about what this one is worth.

I do not see any building divergences so I'm assuming the goal immediately is to close out the quarter on the best close possible using the gas in the tank already there.

HYG has been active the last couple of days, the 3 min positive was mentioned yesterday.

 HYG vs SPX (green)...

HYG's 3 min positive, but...

Nothing after that at 5 min, just in line with the downtrend.

 Our Custom SPT/RUT Ratio Indicator that gave a positive signal creating a low and sideways price movement is in a little danger here of going negative.

Here you can see it on a wider view, the indicator is close to breaking its previous low.

The DIA still has gas in the tank...

This is the QQQ intraday (see the 15 min chart above), it's in line which is what most f the averages look like intraday, no really interesting signals.

IWM 15 min gas in the tank still, but remember how little the QQQ 15 min moved price on the last divegrence, enough to make a lower high.

And SPY 10 min with gas in the tank still, I still suspect this is to close out the quarter (at the close today).

Intraday the SPY is in line.

And the TICK as mentioned , in a narrow band of +/- 750 which looks about right considering price in the averages.

The one thing of some interest is my watchlist is lit up a bit more green than usual which also may be trying to get the best return for the end of quarter, but I think I'll spend some time scouting out a few of those positions.


A.M Update

OVernight the theme has been bad news is good news with China's HSBC Manufacturing data missing, then Japanese Household spending, wages and Industrial Production missed. Following that Europe saw the lowest inflation data in 5 years with Core CPI sliding. This was all spun as bullish, all along the lines of each country or region's Central banks needing to take more stimulative measures even though each is a unique situation and in certain cases has already been ruled out.

This sent Index Futures higher overnight which was not out of line with last night's Daily Wrap and yesterday's data with an expectation of a push for the best close possible on the last day of Q3.

Then around 9 a.m. EDT futures started sliding as Russia is said to be weighing the use of Capital Controls if net outflows that have been exacerbated by EU and US sanctions (in a country that hasn't seen net inflows since 2007) continue to intensify, this immediately put the brakes on the overnight ramp hopes of more Kool-Aid stimulus. 

 ES 1 min overnight and in to the open sliding on Russia Capital Controls news...

As mentioned yesterday, my minimum divergence for a trade is at least a 5 min futures chart, note no positive divegrence here of any significance at all.

 The ES 15 min chart is the same, 3C is either confirming downside or putting in negative divegrence at counter trend bumps.

And the 30 min chart that shows 1 small relative positive at yesterday's opening lows.

Just as an aside, the Rubble vs the $USD is at the lower end of the band in which Russia's central bank would intervene. 

Right now there aren't any divergences of note in the averages, however, the lateral range could create some opportunities, there are still a number of indicators and assets to look at as a.m. trade burns off, but so far I still don't see anything that has enough gas to do much more than try to get the best close for the end of the quarter today, as far as a Wednesday or early Q4 bounce, that divergence isn't there. Today is the last day of Q3 and window dressing.

TICK is in a very narrow +/- 750 band. I don't expect any significant intraday moved any time very soon.

I'll have some other information up now that the a.m., fog is burning off.

Monday, September 29, 2014

Daily Wrap

Tonight's Daily Wrap may be a bit shorter than usual because not much new has been added. Friday in the The Week Ahead post there were a couple of luke warm opinions about this week, first...

" If there's any substantial corrective bounce, I'd expect it to come AFTER Wednesday with the signs of accumulation of sold small caps and mid caps during window dressing, potentially being bought back on an oversold/short squeeze basis, yet still a trade, not a shift in positioning."

If 3C charts showed us anything today, they showed at least that much, some accumulation, nothing big enough to warrant taking long risk or trading around (closing 3x inverse ETFs for 3x long until the move is over and re-entering the 3X short ETFs), even with the leverage, I don't see what we have on the charts right now to be worth the risk, the risk of being long and the risk of letting go of short positions that are working rather well.


Secondly from the same post,

" I'm thinking some more short term downside early in the week, perhaps a lower low than yesterday's before they build a base large enough to really bounce from...leading indicators look like the next move near term early next week will be down a bit as does HY credit."

And obviously today's action on the open was a bit extreme , but comparing where the 3C signals were on Friday, we ended up not only with the lower low, but somewhere around the expected downside and the expected timeframe of early week.

As for what actually happened today, it was almost a snoozer, but things were happening. This is not the kind of market AT ALL, that I want to take any new positions in, just let what's on the table work and wait for the right entry with good confirmation, obviously I suspect that will, if it does indeed come, be in to Wednesday as the new quarter starts, but I don't know for sure whether today's bounce back in which none of the major averages except transports made it in to the green was part of a divergence that can lead to a post Q3 attempt to close the averages at the best levels possible for the quarter or whether it's the divegrence that could lead to a post-window dressing bounce.
The major averages on the day with transports (red) closing green

On the day, it seemed a lot more to me like the price action was more geared toward the best close for the averages for the month and quarter, not necessarily the divegrence that could produce a post-window dressing bounce in which thousands of stocks that have been sold because of VERY poor quarterly performance are picked back up after the reporting period is over on a deeply oversold condition and bounced. The main issue I see with that is according to the charts I'm seeing, the shorts that are left in the market are strong hands that aren't going to be squeezed.

Initially HY Credit was beaten down hard this morning, although it let up later in the day and while Investment grade credit saw a flight to safety bid, it underperformed stocks.

One asset that didn't underperform stocks were treasuries as they ignored the attempt to make it back to green off that ugly open with a TICK plot of more than negative -1800.

treasuries were bid early and despite stock snap back, remained bid.

I mentioned this morning there was an attempt to ignite some momentum overnight in USD/JPY which failed...
 Since futures opened this week (green vertical line), it has been down obviously Hon Kong is weighing on the market and even a sharp pop in USD/JPY was totally ignored by ES 9purple)... However, the currency most reactive to events in China, the $AUD had a bit of a different relationship...

AUD / JPY 1 min vs ES intraday, the only time they really peeled away from each other is during the last hour in which it seemed like they were trying for a green close and missed.

For me, nothing has changed, if there's going to be any accumulation for a post Window Dressing Q4 start, the market needs to pullback and be accumulated more so than it was today which seems as if it was meant specifically for today, gas up as much as possible and try to make it to green which I suspect will be the same theme tomorrow. If so, then the Wednesday date for any potential move to even really start would be about right, but a lot can happen between now and then, especially considering we are already trending down, we are already in stage 4 for the August cycle, we are making lower highs and lower lows and HYG is leading as expected with another lower low.

As far as breadth today, you could draw a sideways scribble next to any of the breadth indicators and that's about accurate for the day, NOTHING MOVED , nothing improved and for that matter, nothing deteriorated much either.

Short term 1-day oversold events did occur with 8 of the 9 S&P sectors red, Utilities, the Flight to Safety Trade were green at a +.65% gain and Consumer Discretionary was the laggard at a -.52% loss, which really wasn't that bad considering the way the markets opened.This is almost the opposite of Friday's close in which all closed green which is a 1-0day overbought condition that usually closes red the next day. Today therefore is a 1-day oversold that "usually
' closes green the next day, the issue is we have been seeing 2 and even 3 of these days in a row before seeing any relief in the market,  but they have been very useful.

The Morningstar groups had 174 of the 238 red today, that's almost the opposite of Friday's 220 of 238 green. While not quite as extreme, Friday's figures pointed to a red close today while today's are supportive of a green close tomorrow. 

The Dominant Price/Volume Relationship Friday was EXTREME at Close Up / Volume Down, the most bearish of the 4 combinations and again suggesting a 1-day overbought condition that should close red today as we did. Today's Dominant theme was non-exxistient so the only thing that's 1-day oversold is the S&P sectors and to an extent the Morningstar groups, but not nearly as bad as they were last week, thus today felt "LUKE WARM" and one of the reasons I think today was more about closing the quarter as best as they can. 

As you can see, when these indications are at extremes, they are very effective, the same in a large way can be said of 3C signals, because they didn't pullback and build today, instead chasing the best close possible for the quarter, they looked a bit like warm.

HYG did put in an interesting 3 min leading positive that stops there, again whether for the end of the quarter or a post Q3 bounce, I can't say and that's one of the best reasons to sit on my hands right now until things become clear in this regard and I know what kind of probabilities I'm looking at and what kind of risks.

Of course there is the new Indicators, VIX Inversion and the SPX/RUT Ratio that seem to suggest the general theme for the week or at least mid-week is on track...
And I'm not saying there's not gas in the tank with the 3C signals, the question as tomorrow is the last day of the quarter is a matter of intension.  We're not betting on red or black like a Roulette table, if I was, based on what's left of the divergence and the character today, I'd say a green close is in the cards for tomorrow, but a green close doesn't mean it's worth the risk of being long or closing short positions to trade around a corrective move.

Until that aspect of the market becomes more clear, I'm sticking with the Stage 4 trend, the distribution on a big picture basis, horrible market breadth and any other one of a hundred other indications showing this market looks a lot like the two pictures posted Friday , the first 3 actually in Week Ahead charts. & Daily Wrap.