Friday, November 28, 2014

Important Intraday Update

For a half day/holiday , something is going quite wrong in the market today. I'll try to get leading indicators out as well. Many charts I haven't notated, I don't think they need them and I'm pressed for time.

If anything, you'd normally expect a higher proportion of retail traders (vs normal market days) to be active today and we know their bullishness is off the charts so the below charts are difficult to explain away unless there is in fact something very wrong here.


 My Custom TICK Indicator vs SPY, note how low TICK is, this has NOTHING to do with volume and everything to do with the proportion or ratio of advancing stocks per bar minus declining stocks per bar. Compared to the recent trend, today stands out like a red thumb.

 As does the TICK Index , not a move above 500 all day!

 IWM intraday just lost it at new leading negative lows for multiple weeks

 IWM distribution in to Wednesday's close and in line today.

 IWM 5 min with a very fast/deep leading negative through the week.

 Considering the macro trend and last negatives at the last major highs, this is a real problem -2 hour chart.

 QQQ intraday today has lost it 3C and now price.

 Deep QQQ intraday distribution

More QQQ deep
 Considering where QQQ price is on this 4 hour chart and the size of the last 2 negative divgerences that took it to lower lows, this speaks for itself. This is the epitome of the expected market move to come next.... very similar to ALL Leading Indicators

 SPY intraday

distribution in to Wednesday close

deep leading negative 15 min SPY.

Again, all things considered, it's not that hard to believe in a move much stronger on the downside than the up...

HYG Update

As I said in the first/second week of October as the market was still making lower lows in to the mid -October low/base, "There's only one reason to accumulate HYG", which is one of numerous reasons we knew a strong upside move was coming.

Along that same logic as we saw HYG distribution earlier in the week, there's only 1 reason and it's not institutional money thinks it and risk assets are going higher (HYG is the institutional equivalent to our 2-3x long leveraged market ETFs).
 HYG accumulation that bother me last week and it's support for the market, then distribution setting in this week with a sharp leading negative divegrence taking it down today significantly.

 This is what the HYG intraday chart looked like Wednesday.


 Increasing HYG distribution in to Wednesday's close...

This is what supported the October rally's start and the last week, when it has failed, the results for the market have been bad, it's in a massive month+ failure and the short term just failed as well, what we call a full house in multiple timeframe analysis.

Quick Intraday Update

I expected a fairly dull day today. For a half day and such low volume, there's a surprising amount of intraday damage being done, far more than the rest of the week. I'm gathering charts now and will post in just a few minutes.

TWTR

I have a lot of interest in several assets today, I'll try to get to as many as possible as the market still remains dispersed.


TWTR looks exactly like a stock that is behaving as if it were in a bear market rally, I've talked about these numerous times, it's one of my reasons I think bear markets are the fastest way to make money as fear is much stronger than greed, falling 2.5 to 4x faster than a bull market rises on average and the bear market rallies which can be seen a mile away are SOME OF THE STRONGEST RALLIES YOU'LL EVER SEE...The reason is the exact same reason the October rally had to be so strong as sentiment was near all time lows, everyone calling a bear market with the Fear and Greed index (0-100) pegged at zero for consecutive days. In other words, to overcome that sentiment and actually get retail to buy, because in a zero sum game someone has to lose for someone to win and you can't have everyone on the same side of the trade such as it was at the October lows, the rally has to be overwhelmingly impressive, not just to overcome the bearish sentiment, but to get retail to be wildly bullish again... teaching them a dangerous lesson about buying the dip. Even in a -10% decline, the dip should be bought which is like the Army Captain who came across a minefield and decided the best course of action was to close his eyes and lead his troops across. The fact they survived teaches a fatal lesson for the next time they encounter a minefield.

For the most part my gut feeling they'll try to pin TWTR to this area in to the close although there looks to be some fairly heavy intraday profit taking,.

Here's a broad look at TWTR, not EVERYTHING is roses...
It's difficult to see now because of the limited chart history, but there's a lower high, if TWTR makes a lower low, for all intents and purposes TWTR is in a primary downtrend.

The volume at the red arrow is bearish churning, the volume at the white arrows is bullish intermediate capitulation/selling climax.

Possible TWTR buy signal, 1 indicator off, but still pretty far off. The last two signals were effective.


 TWTR long term 4 hour macro trend accumulation around April/May and a move up in to very strong distribution. There's another accumulation area to the far right  (just passed), this looks like a counter trend rally.


 To the left 3C accumulation at the last selling climax where shares are abundant to fill institutional orders and cheap, however at the negative divegrence in the middle, this is seen on a 4 hour chart, this was VERY serious distribution of TWTR.

Again to the far right an accumulation zone just passed.

 On a 5 min trend, again the top/distribution was exceptionally strong, not like a typical wave down for a constructive pullback. To the right the accumulation zone mentioned, judging by both sizes, I'd say this is the equivalent of a bear market rally even though TWTR doesn't have enough history to create a primary downtrend yet- it is very similar to the market at the October lows.

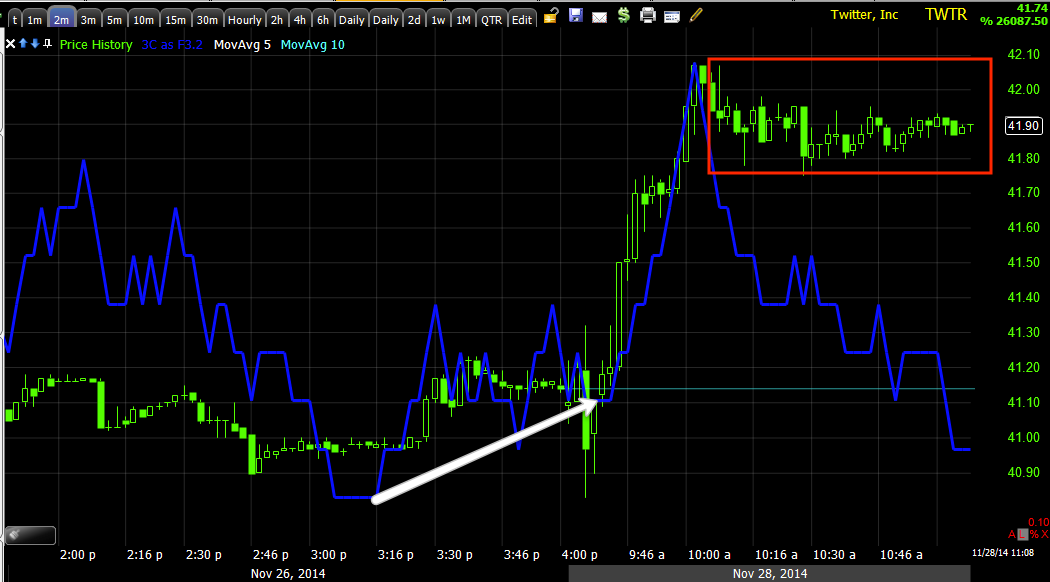
 Recent intraday charts with what looks like market makers/HFTs perhaps accumulating Wednesday afternoon for today's move. Thus far this chart is holding which is why I think they'll pin the close around here, although some heavier sell side volume is picking up.


 Intraday 3C is showing distribution which is just passing the normal profit taking on a move like this.
 This 1 min chart "looked" like it was going to support with an intraday divergence, that fell apart.

And the 2 min chart is looking worse right now.

I checked several other indicators and versions of 3C to see if there were stronger signals standing out.


 Again a lot of damage at the last pivot macro high around September and recent accumulation,  but looking VERY much like a bear market rally does.

30 min chart showing the same as the 30 min above.

 Despite the September damage, this 15 min chart's accumulation is plenty strong enough to continue a strong bear market rally, however as impressive as these are and they are the most impressive rallies I think I have seen outside of a short squeeze which has its limits... They are there for a reason. Look at the 1929 Dow's first bear market CT rally after the initial break (before you'd have known it was moving to a bear market.

 Again intraday it looks like profit taking is heavy and by Monday this may be something more than profit taking.

However since there's such a large recent accumulation area I don't see the rally ending soon although it may get very volatile especially with not so great media out on TWTR users.

Remember how quickly the star stock of the decade AAPL broke at all time highs once Hedgies found out Dan Loeb got out.

 The tightest Trend Channel is holding with a stop at $41.50 on the close.

For the length of this move, this is the channel I'd use for now, stop around $40.85 to $40.90.

I'll update this Monday and if you need an update sooner email me.

While I think a CT rally is VERY likely, I don't think this ends well for TWTR.

Be Careful with Airlines

I suspect they'll be able to hold today's oil based gains in to the close only 1.5 hours away, but come Monday it may be a very different situation.

There's intraday profit taking, it remains to be seen how strong that is, whether just profit taking or outright distribution (but the rumor/sell the news).

Here's LUV, AAL and DJUSAR (Dow Airline Index), all looking to be struggling intraday...
 LUV intraday having profit taking issues that have been growing through the morning.

AAL the same thing...

The Dow Jones Airline Index, also the same, even worse in fact.

This may not be an issue before the close, but early in to next week it is looking as if it will be.

Early Indications, HY Corp. Credit Smashed

It's not as if we couldn't see it coming in HYG's negative divergence/distribution, but this is quite shocking on the open, obviously a result of the fall-out from OPEC and perhaps a message of the market similar to the first week of October when I mentioned HYG accumulation with the comment, "There's only one reason to accumulate HYG", that's in order to support the market in a risk on move.

The averages themselves already have quite a bit of dispersion for this early trade...
 DIA is up, but not confirming as of yet, I'll check it again in 20 minutes or so.

The SPY 1 min is confirming the negative price action, however as of Wednesday's close, the 3C charts were showing a negative divegrence in to the closing ramp, that seems to have picked up right where it left off on Wednesday's close.

It seemed SPY was in line most of Wednesday, but there's a larger (weaker) relative negative divegrence against the close Wednesday and a specific (stronger) leading negative divergence 3-min in to Friday's ramp/lever pulling close to keep the averages green as everything from the JPY carry to SPY Arbitrage was used, including HYG.

 The IWM also showed the same distribution in to Wednesday afternoon's closing hours, especially sharp in to the close 1 min

 And on a stronger 5 min chart, Wednesday looks worse than it first appears, a strong leading negative intraday divergence,  it's no wonder there's dispersion this early in the averages.

 The QQQ 1 min "looks" to be in line on the open and in an hour it may be, but give it some perspective and...

Not quite.

This is the distribution in HYG I had been talking about early this week and especially Wednesday, it has led to a big gap down in High Yield Corporate Credit / HYG, one of the first levers of defense of the market.

Credit leads, stocks follow..." this may be an interesting day indeed for signals, although the low liquidity and half day make it hard to follow through on Credit's lead so quickly, we'll see how much more damage is done shortly.


First Two Alerts of the Day-Copper and Oil

Both just opened and crashed to more than 5 year lows, not seen since 2009. Dr. Copper crashing on the world growth outlook, oil, well that's obvious, however what's not quite so obvious is the conventional wisdom of lower oil prices means lower gas prices which means more consumer discretionary spending. Oil has been low and moving lower for sometime,  this week's consumer sentiment has not been good and the real reasons for it like a +300k Initial Claims print when you'd think retailers and the such would be hiring for the holiday season, certainly not firing en masse as well as sub-indicies in data like the Richmond F_E_D showing the employment index and average work week both down- the hard data behind the sentiment.

There's a lot more to the spider-web effects of what has now essentially become an oil price war with the Saudis (our allies?) crushing the US shale drilling industry, removing competition as oil is priced lower than most US shale producers can even get it to market, which is about to result in a spate of bankruptcies and worse, defaults , especially in the HY credit space which is going to be in the spotlight over the next several weeks and months, but I'd think as early as today as the OPEC decision's effects are front run.

If you are old school, then this morning's Dr. Copper plunge is very telling...
 Copper- DJ total return index with a gap down to more than 5 year lows.

And WTI (West Texas Intermediate) Crude, also gapping down to more than 5 year lows.

Good thing the USO charts on Wednesday didn't show anything of interest as we chose to forgo this possible trade calling it "Gambling", indeed...


Pre-Market Indications

Good morning, I hope everyone's holiday/Thanksgiving and/or day off was relaxing and peaceful, let Black Friday craziness begin!

For the moment I'm just going to cover the futures indications which are slightly firmer, but relatively flat 3C wise as Europe remains in the red, but off the worst levels of the day on inflation or lack of... data and Italian unemployment joining France at record highs, but what will reverberate across the markets more than anything causing a spate of high yield defaults in the shale oil drillers space is OPEC's decision to leave quota's unchanged, leaving oil prices lower than shale drillers can afford to compete with as Saudi Arabia seeks to squash the US oil source. Look for increasing shale driller defaults along with drops in HY Credit which many are leveraged with.

As for the averages...

 ES, notably flat, not very volatile looking...

 TF with small negative divergences, also not very volatile looking.

 And NQ off the lows overnight with 2 small negative divergences.

The driver...
USD/JPY with a stronger dollar on a weaker Euro after the Italian unemployment and Euro-area soft data inflation at 5 year lows.

More on that momentarily..

The big news is oil, Brent Crude after OPEC's decision to leave output unchanged...

This is the market mover for now with the FTSE down only .16% now after paring losses with oil leading the way lower, Shell and BP represent 12% of the FTSE 100's market weight, that's where all weakness has come from , the oil space.

The US session ends at 1  pm and as of now looks to be tame and quiet.

More in a moment.