Thursday, January 15, 2015

Market Update

While there's always more to look at as the market is dynamic, my best guess right now is we are pretty much back to where we started, looking for a bounce as the market has clearly been bearish in movement and in tone and that's what markets do. Even in a raging bear market you'll typically have just about as many up days as down days, it's just how much each of them moves.

When I say we are pretty much back to where we started, that is an oversold bounce. That's also largely charts that are positive out to about 5 mins and charts that are negative 10 mins and beyond, again where we started with all of this.

Te market can't do this on its own, at least not until it can potentially trigger a short squeeze, so the levers are active as we expected, the only addition I'd add is the oil bounce which until recently was viewed as its own event, I think the broader Energy sector (not just oil, but drillers, explorers, transporters, storage, etc.) will contribute to the market bounce, but nothing has changed with the oil bounce either, it's still a bounce, it's not a trend change and at some point it will roll over again.

We are also back to using price strength/underlying weakness to our advantage with a number of trade set ups already put out and more as they become available. Finally I think to resolve the 5 min charts, just as I said earlier in the week, we'll need prices to move up. The question I have that we'll have to wait on an answer is whether or not the market aggressively sells any price strength as it has the last week or so.

Since things are fast moving, I'll have to add updates in sections or categories, first I'll add the charts of Index futures and the major averages, the timeframes I honk are the most important which have not changed 1-5min positive- 10 min and longer negative. Leading Indicators should turn negative or more negative in some cases, in to the bounce, the same as distribution should be more apparent as smart money HAS to sell in to price strength.

This is especially true right now as NANEX has made clear, the S&P E-,ini futures contract is at 3 year record low liquidity, that means any larger positions trying to be sold would essentially crash the market, there's no liquidity there to absorb such positions as SPX E-mini liquidity is at its lowest in 3 years right now. That also means, BEWARE OF VOLATILITY, it should reign supreme which makes it difficult to trade a bounce long as you should see sharp intraday moves down as well due to the liquidity issue.

I'm not as concerned about the 5 min SPY chart, I'm not done with looking at it, but it's not anything that would change any of my plans or the way I intend to use price strength/underlying weakness on a tactical basis to achieve longer term strategic goals.

The TICK chart is a horrible mess, probably indicative of liquidity problems exacerbating moves as there are quite a few -1500, several over +1200.

Here are the updated charts, you'll notice there are mostly short term chart changes (bounce) and a lot of charts look the same as you get in to the 5+ min range, some even in the 3 min range.

 SPY 2m

SPY 3m

 SPY 5m


SPY 15m

QQQ 2m

QQQ 3m

QQQ 5m

QQQ 10m

QQQ 15m

IWM 1m

IWM 2m

IWM 3m

IWM 5m

IWM 10m

Bounce About to Start

Whether this is just an intraday bounce in to the close or the start of the oversold bounce we have been looking for, something is about ready to start and I suspect it carries over at least until tomorrow morning.


GLD Charts

I moved out of a GLD position not too long ago at a very small gain, just because the near term charts were all over the place. Gold is "typically" bought as a hedge on inflation "EXPECTATIONS", as you might have picked up from the F_O_M_C, "they" expect inflation to move toward their long run goal of 2%, but acknowledge near term inflation expectations are not so hot.

In fact they also said that they'd raise rates at the current 1.4% inflation which is below their target, so long as they felt reasonably sure that inflation would move toward their target.

I may be getting off track a little, but Bloomberg just reported that Yellen just said (as posted in the A.M. Update today),

"Yellen has signaled she wants to look past short-term market fluctuations and place economic outlook at center of policy making; to succeed, she must wean investors from the notion that the Fed will bail them out if their bets go bad"

This is an interesting statement or message because taken with the F_O_M_C minutes and press conference, it was clear that Yellen is looking to raise rates sooner than later and the 2% inflation target not having been met has been rebuffed with the F_O_M_C's willingness to hike rates at current inflation levels of 1.4%, below their long-run target, as long as they feel reasonably assured  inflation will move toward their target (which is a subjective statement and definition that can be used however one pleases, so long as they preface any action with the words "They feel reasonably sure" despite data). Additionally now we have this new "Big picture perspective" from the Bloomberg piece/quote above and warning that the F_E_D does NOT have traders' backs as they have believed for a long time and continue to. This is along the lines of Yellen's, "We keep telling the market what we are going to do, if they don't listen, I wash my hands of it", except this is even more straight forward, we are proceeding, you are responsible for your trades, don't expect us to bail you out (RAMP THE MARKET).

In any case, one issue is the F_E_D's subjective definition of what their inflationary outlook is and that's whatever they say it is and the other issue is the actual inflation data which doesn't look very inflationary right now. Note I said "right now". Who knows what the ECB does, how they do it and what it turns in to, Japan's QE  hasn't exactly done what they expected on the inflationary front.

These are really just asides to the charts which is the reason for the position and post.

 GLD's 15 min chart which is along the lines of a swing trade and then some. Whatever events have transpired, it appears there's a negative cycle set up on this 15 min chart.

Gold futures show something very similar. Note I'm not getting in to longer term charts or forecasts yet, which I suspect will be long term bullish, but the data just isn't clear yet and there are too many wild cards that can move thing either way for a period or indefinitely.
 YG/Gold futures 10 min negative as well.

The 5 min chart shows a [positive / accumulation cycle and a negative distribution in to it recently.

As far as the timing charts now that we have a cycle set up...

This is GLD's 2 min leading negative

YG intraday is showing a negative divegrence on a parabolic move higher intraday.

And the 1 min timing chart (in this instance) is clearly negative in to GLD's gap higher, which on a daily chart is looking like a possible closing Star, Doji Star or maybe Shooting star, the volume surge is in place which would make any of those reversal candlesticks about 4 time more effective and probable than average volume. THIS IS ALSO RIGHT IN TO THE 200-DAY M.A.


Trade Idea (Short term Options) GLD Speculative Puts

Gold ran up on SNB's action today, however, at least for a near term swing, I suspect we are ready to see some downside very soon, quite possibly before the close.

I'll be opening a half size (speculative) position in Feb 20th GLD puts, just because the market is so fluid right now with news events and the actions, reactions and fading of all of the above.

I'll post charts in just a few minutes, but there are plenty of short term negatives in place and remember that Gold is typically bought on inflation expectations which may build, but right now after yesterday's retail sales, today's Initial Claims and Philly F_E_D (especially the employment sub-index), it would seem that inflationary pressures are not high on the list over the next few days of perception, but this is really about the charts, I'll have those out in just a moment.

I'm looking at this as a very short term trade and speculative. Again, GLD Feb 20th 121 Puts.

USO Set for Continued Gains

The SNB action caused volatility in Crude (Brent) futures early this morning, and they saw some downside, not too dissimilar from yesterday's stronger than expected EIA inventories build which initially sent crude lower on a quick knee jerk. However, like yesterday's post EIA reaction, I believe USO / Oil is recovering and getting ready to make another leg higher shortly.

 Crude Futures ramp and then fade after the SNB's action early this morning. However the intraday /CL chart looks to be recovering.

As does the 1 min intraday USO chart.

The 2 min chart is overall positive and flat intraday, however the 1 min positive divegrence should continue to build and cause a positive divergence (migration) in the 2 min intraday.

 All of the same applies to the 3 min chart above, which is still leading positive.

And the 5 min chart which is also leading positive.

This really isn't about crude, it's about a cycle that Wall St. has started and they'll usually finish it as we saw with the adverse EIA report yesterday and as we are seeing now post the SNB reaction to the downside.

Quick Market Update

You'll have to excuse me this morning. I'm spending some time looking at everything I can with  a fresh pair of eyes, no assumptions and just seeing what's there so I'm actually going through quite a few charts.

The main reason, which I'll show you is the SPY looking better than the QQQ or IWM and looking like a potential "W" base from the January 6th lows until the recent price action.

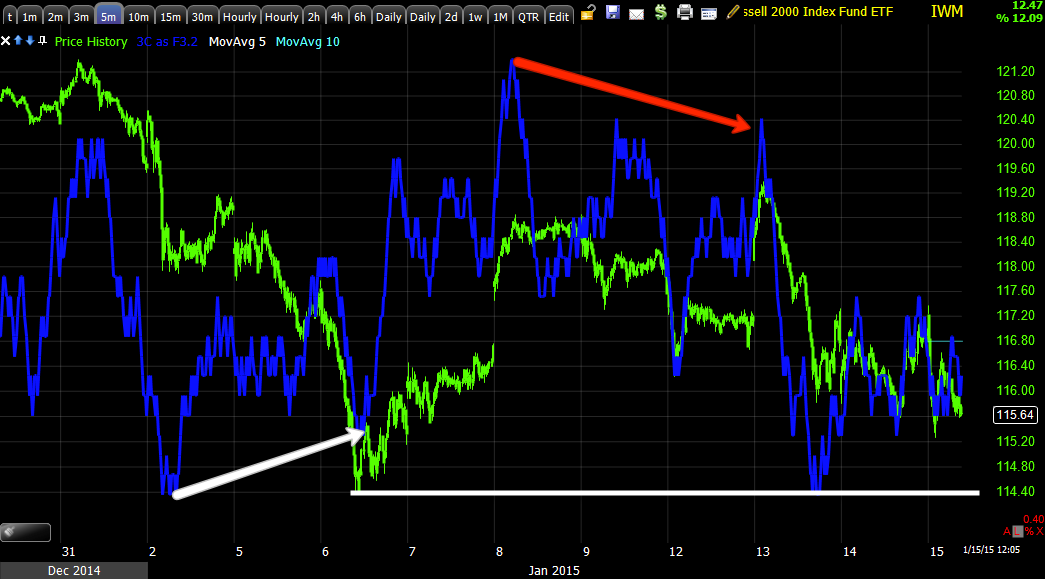
 With everything else that's going on, I normally wouldn't look twice at this IWM 5 min chart.


However this SPY 5 min showing more positive tone the last two days has me looking twice. Of course we have expected an oversold bounce since the positive divergence on the 5th and 6th which didn't go very far before showing signs of trouble on the 8th so the move never lived up to its potential.

There's also the SPX:RUT Ratio and VIX Term Structure which is similar to the SPY chart above.
The SPX:RUT Ratio (red) has a slight positive disposition and the VIX Term structure has its second buy area. What I'm trying to determine among other things is whether the first buy area already was spent on the move up to the 8th/9th and the current buy signal is the oversold bounce we have been looking for any way or whether this is a larger pattern like a "W" bottom .

There's also a lot of things that will change in the market because of the SNB's overnight actions, just from a perception point of view and perception is more than enough to move the market. So I'm also looking for anything that has or is changing since yesterday before the SNB action and today after the SNB action that is suggestive of a change in perception.

I have to look at this more carefully to be as reasonably sure as I can be that this isn't something different than current expectations or current expectations as they develop.

So I'm going through breadth charts, currencies which have been turned upside down this morning, Leading Indicators, sectors,  averages, etc.

Intraday there's a similar disconnect between SPX futures and NASDAQ/Russell...
 ES 1 min intraday is more positive looking than the other Index futures...

NASDAQ Futures intraday have a small relative positive divergence.

Russell 2000 Index futures are in line at best and we could make a reasonable argument for negative.


 SPY 1 min is pretty flat or in line intraday

2 min isn't very exciting either. This is one of the reasons I'm looking, if the 5 min chart were reflecting a "W" base, I'd expect to see much healthier intraday 2 min, 3 min charts.

 SPY 3 min with a small positive, however this is not far off from the bounce we have been looking for most of this week.

And of course the 5 min chart from above.

QQQ 1 min looks like it will see an intraday move higher, maybe the start of our bounce?

QQQ 2 min also reflects something similar to the SPY 3 min above, this is about the right size for the bounce we have been waiting on.

QQQ 3 min is in line with the recent negative trend.

And the 5 min doesn't look very bullish to me, this again is why I'm looking in to all of this when comparing this to the SPY. USually we'd have strong confirmation between all of the averages if that indeed was a larger "W" base in the SPY.

IWM 1 min with a slight positive.

IWM 2 min in line with downside action.

IWM 3 min in line with downside price action.

And the IWM 5 min chart not showing much.

All of the QQQ and IWM charts and a lot of the SPY charts reflect the shorter term bounce we have been looking for in the area and don't raise many questions, the 5 min SPY chart and the Indicators above are what raises some questions for me and why I'm looking in to it so closely.

Intraday TICK is lateral and very choppy as well as volatile.


So I'll be back with you with anything I might find, I wouldn't jump to any conclusions based on the fact I'm looking at this, that's all I'm doing is looking, not saying anything is different.


A.M. Update

Sorry for the later than normal A.M. Update, but quite a bit has happened overnight and I wanted to make sure I had some basic grasp of the scope.

The SNB (Swiss National Bank)  today dropped the 1.20 EURCHF floor while at the same time lowering the negative interest rate on sight deposits to -0.75% from -0.25% previously, as well as moving the 3m Libor target to between -0.25% and -0.75%. The SNB argues that the floor was an exceptional and temporary measure that 'protected the Swiss economy from serious harm' but that the economy had had time to adjust to the new situation. It continues to argue that the franc had recently depreciated 'considerably' against the dollar. 'In these circumstances, the SNB concluded that enforcing the minimum exchange rate for the Swiss franc against the euro is no longer justified'.

This is the change in stance over just two days and why this move is such a shocker worldwide...


From January 12th,

"The Swiss National Bank's cap on the franc at 1.20 per euro will remain its key monetary policy tool, the central bank's vice-chairman said in a television interview broadcast on Monday. "We took stock of the situation less than a month ago, we looked again at all the parameters and we are convinced that the minimum exchange rate must remain the cornerstone of our monetary policy," Jean-Pierre Danthine told RTS."

Today,


"Recently, divergences between the monetary policies of the major currency areas have increased significantly – a trend that is likely to become even more pronounced. The euro has depreciated considerably against the US dollar and this, in turn, has caused the Swiss franc to weaken against the US dollar. In these circumstances, the SNB concluded that enforcing and maintaining the minimum exchange rate for the Swiss franc against the euro is no longer justified."


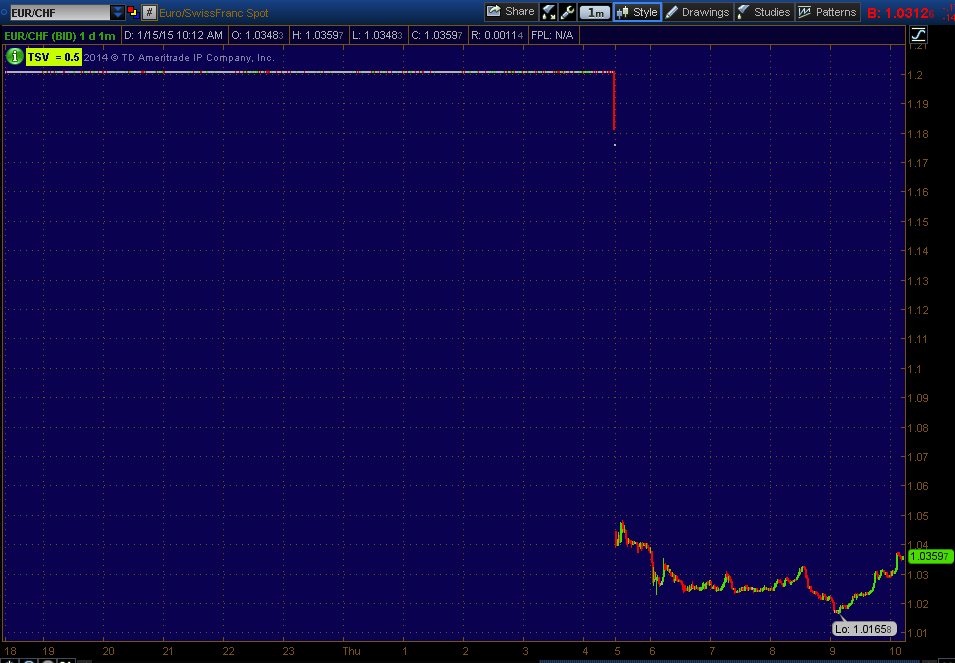
EURCHF initially dropped 40% to almost 0.85. It quickly reversed seemingly with the help of SNB interventions at levels just above parity to the euro. The statement noted that 'if necessary' the central bank will 'remain active in the foreign exchange market to influence monetary conditions' which it seems they likely were this morning. 
EUR/GHF

The SMI (Swiss Market Index) was down almost -15% at one point and has recovered some to approximately -10% currently while the rest of Europe is green.


It would seem likely that today's decision will have significant ramifications in Switzerland. At levels close to parity many businesses and investment decisions might not be seen as viable anymore and over time a significant volume of economic production could move outside the country. If so, there could be a significant deflationary shock possibly not too dissimilar to the one Switzerland might have suffered had the floor not been introduced in 2011.

Snap analysis from some banks suggests that the SNB may well have taken pre-emptive action ahead of anticipated ECB action by scrapping the floor as the cost would have been amplified by the drop in the EUR allied to cutting rates in order to deter market participants from parking their cash at the Swiss central bank.

Beneficiaries include the Japanese Yen and gold, while the Euro saw outflows across virtually all currency pairs and the USD is sliding...


 USD/JPY


EUR/JPY

Yen Futures

Gold

Crude 
And Index Futures...
ES / SPX futures

Hedge funds CRUSHED:
"Just before lunch local time, the Swiss National Bank took on virtually every single macro hedge fund, the vast majority of which were short the Swiss Franc and crushed them, when it announced, first, that it would go further into NIRP, pushing its interest rate on deposit balances even more negative from -0.25% to -0.75%, a move which in itself would have been unprecedented and, second, announcing that the 1.20 EURCHF floor it had instituted in September 2011, the day gold hit its all time nominal high, was no more."
Some soundbites:
"This is extremely violent and totally unexpected, the central bank didn't prepare the market for it. It's sparking panic across all asset classes. It suddenly revives the risk of central bank policy mistakes, right when central bank action is what's keeping equity markets going."

"Major losses in euro-franc trades are causing panic selling and deleveraging across the board."

What happened next was truly shock and awe as algo after algo saw their EURCHF 1.1999 stops hit, and moments thereafter the EURCHF pair crashed to less then 0.75, margining out virtually every single long EURCHF position, before finally rebounding to a level just above 1.00, which is where it was trading just before the SNB instituted the currency floor over three years ago.
This should mean less support for the Euro as the SNB were the largest daily buyers of Euros.
The move is being taken as ECB QE being a virtual certainty and likely at the Janauary 22nd meeting next Thursday.
From Goldman, 
"This is a massive message from SNB to the market : ECB is going to do QE, and it’s going to be big... Removing the SNB peg takes out one of the biggest EUR buyers in the market. And of course, VERY notable this is happening 1-week ahead of the ECB, they possibly realised they could not continue to buy unlimited quantities when the ECB might print unlimited quantities."

In the US...

Bloomberg: 
  • Yellen has signaled she wants to look past short-term market fluctuations and place economic outlook at center of policy making; to succeed, she must wean investors from the notion that the Fed will bail them out if their bets go bad

Financials continue getting battered, you can see why I'm so fond of the FAZ position, which was long before earnings...

After JPM and Wells Fargo's disapointing earnings yesterday, today it was Bank of America, reporting a 50% collapse in its sales and trading from Q3, down $600 million from a year ago to just $1.7 billion in Q4.  Revenue of $18.96 billion, which missed expectations of $21.03 billion by over $2 billion and down $2.7 billion from a year ago. I've long maintained that US QE was a "STEALTH BANK BAILOUT"  because most of us recall how politically unpopular the early crisis bank bailouts were, yet very few traders and virtually no "Average Joe-Voters" would understand QE and how it benefitted banks. Now that QE is over, without the Fed's visible hand manipulating markets every day, banks are a ticking time bomb just waiting to blow

It also appears BAC has fired over 4000 employees.

Macro US Data...

Tumbling retail sales yesterday crushing the cheap gas, more disposable income narrative and now surging jobless claims...  Initial Jobless claims surged to 316k (smashing expectations of 290k) and has not been higher since June 2014.  The BLS reports no unusual activity - so economists can't blame this on weather. Details on state-by-state job losses are lagged a week so we will not know if this is Shale Oil region-related but yesterday's Beige Book and day after day of announced job cuts by the energy sector suggest it is.

I was just saying in an email yesterday,

" I also feel there's an instability there (rising market volatility), and although everytime I worry about this (surprise move), the market tends to give the signals I should wait for, so I'll wait, even though I do have a feeling of randomness and surprises."

Well this morning was a VERY unpleasant surprise for many FX traders and hedge funds.

Now, lets move on....