Wednesday, February 18, 2015

UNG Follow Up

Our last UNG post was Feb. 10th, UNG Update.

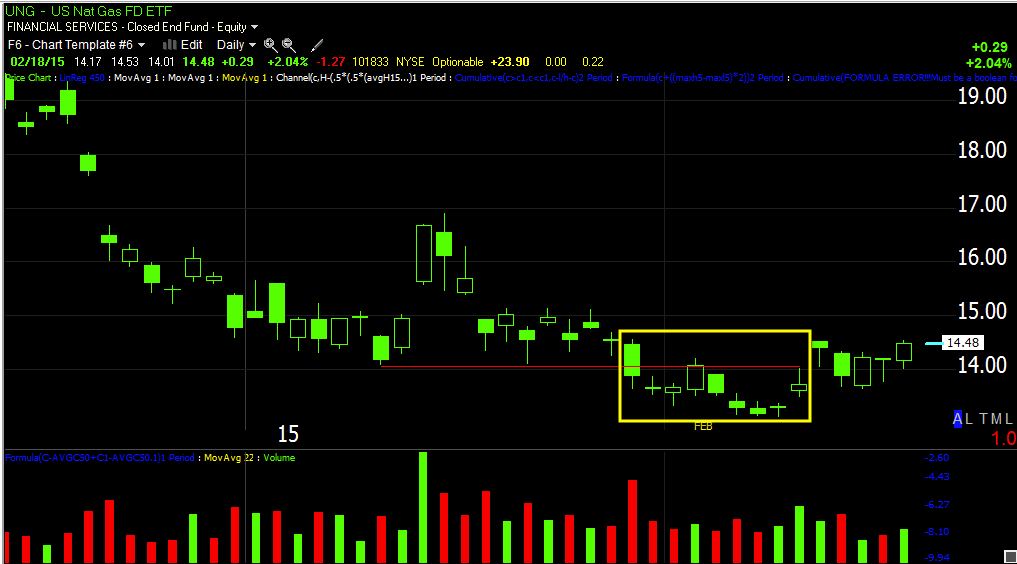
In that update, I suspected we had just seen a stop run (head fake) in UNG,
UNG daily chart stop run/head fake below the $14 level

THERE IS SOME RESISTANCE LOCALLY AT THIS LEVEL, BUT PROBABILITIES FAVOR AN UPSIDE MOVE.  REMEMBER THE EIA NAT. GAS INVENTORIES ARE TOMORROW MORNING.

 On a 60 min chart, the shakeout would be below the yellow trendline which is also where the 60 min chart leads positive, in other words it looks like shares shaken out were accumulated.

 A closer view with a 15 min chart, but the size of the divegrence reaching a 60 min chart is really the most impressive.

Very short term, the 3 min chart is positive at the lows and in line since with some local resistance, all in all the probabilities lay with the 60 min chart, thus UNG should be able to break above local resistance, we'll see if the EIA is the catalyst tomorrow morning.

USO Follow Up

If you saw yesterday's USO Update then you probably know we were expecting an additional pullback and perhaps a stop-run before USO started its next leg higher, if not check out the linked post above as it gives a low risk, high probability entry and the areas to watch for such an entry.

USO is down overall since the F_O_M_C minutes, but it was choppy and down on a strong move down in the $U?Sd which would normally send $USD denominated assets higher, but so far it's moving in the direction we expected earlier from last week and yesterday. There are some early initial signs that we may be right on with yesterday's set-up.

 This is the new trendline / rectangle consolidation or through time laterally, but I suspected it will pullback and perhaps even below the $18 area to put in a stop run before a new leg higher. Because of price action I had to re-draw some additional trendlines, an ascending triangle (bullish) and it looks like we may just break below it as expected yesterday.


 As of the capture of this chart, price was sitting right on trendline support, it looks like it will slip below.

 The main counter trend rally chart is now the 2 hour positive divergence, still not the kind of chart that says oil has bottomed, it's more along the lines of a counter trend rally which is sharper and stronger anyway, it's just not a change in trend.

 The 15 min USO chart through the consolidation has been pretty clear that a pullback to the lower end of the consolidation range is probable which means a stop run below the range is highly probable and that's where we would want to enter any long positions in USO on a discount and a timing basis.

While this is EXCEPTIONALLY early, the thing we look for in a pullback or decline/head fake move is accumulation of lower prices, so far, even before the F_O_M_C, lower prices have initially resulted in the start of accumulation of lower prices which lends credibility to yesterday's planned set up trade, however this is just a start and there's more confirmation to go, but all in all I think this is very high probability for a second and much stronger leg higher after a pullback and likely a head fake/stop run.


F_E_D Sounds Lost

It has been my opinion that the F_E_D needs to hike for reasons they haven't made clear and don't want to make clear, but perhaps the BIS (Bank for International Settlements, also known as the Central Banks' bank) has in their annual assessment in which they called "Leading Central Banks " as being so overstretched or stretched thin, that they (the BIS) doubts they'd have the resources to deal with even a "garden variety" recession, much less something worse.


The last policy statement definitely came off more hawkish than usual, but the minutes, if not more dovish than the policy statement, are at least, well.. more confused with the F_E_D not sure which indications to look at and what are appropriate levels. In initial reading (I haven't read the entire document), there also seems to be a move toward redefining inflation or maybe even deflation to account for effects of lower oil prices. All in all, the tone of the minutes is quite different than that of the policy statement.

The F_E_D has gone from "Lower oil prices are transient and if anything, good for the economy" to "Lower oil prices" could dampen economic expansion, gee you think? I'm specifically talking about the lay-offs and the US Shale drillers being squashed out of existence by low oil prices.

There was talk about removing patient and how that may lead the market to focus on a date. They did find agreement that policy should stay data dependent, which is almost ridiculous, what else would it be? I suspect there's a reason that was injected in to the statement that we'll only understand later.

While there was certainly a general cautious tone, more so than the policy statement, they also added the strange, "Risks to their outlook remained balanced", so there's pretty much two different messages in one statement which could represent the differing views of members, but the way it was worded was more toward consensus, it wasn't "Some F_E_D officials", it was "F_E_D officials".

Interestingly in the initial knee jerk, Financials didn't move with the market.

 Financials did not act well right off the bat.

While it's still early, the IWM has retraced the knee jerk gains.

As have the Q's

And the SPY... but,

The $USD has not...

There's plenty to check on in the next hour, I don't assume a knee jerk reaction is over that quickly, but for now, it is as you see it.


ECB Gives Greece Additional $3bn Emergency Liquidity

This news broke just before the minutes.


Initial Minutes Sound More Dovish then Jan. Policy Statement...

Market Update/Leading Indicators

You probably saw the Index Futures update already, as for Leading Indicators, there's a strong move toward protection,  these F_O_M_C minutes from what was otherwise a hawkishly toned policy statement, have some big players worried, whether they have inside information or not (lets not forget the F_E_D did leak the minutes a day and a half ahead of schedule by email to 155 investment banks, hedge and private equity funds).

The Pro Sentiment Indicators have declined again so far today, Credit is a bit wishy-washy compared to yesterday, but a big move in Credit didn't  take place until the afternoon and many got worse in to the close.

 For a second day (perhaps even a 3rd) VIX is way outperforming the inverted SPX correlation, the move to protection is bid.

Here's the trend for VIX v SPX, the last few days which I can only assume is either the reversal process and/or the Minutes release, has definitely seen VIX outperformance.

 Yields are down today and SPX prices are in line with their reality for the most part (5y)

If commodities are once again acting as a leading indicator (they have been on the layout as they use to be until QE skewed them as the F_E_D sought to fight commodity/input cost inflation), then they are giving a bearish/negative signal vs the SPX.

 HY credit overall is already divergent.

Today's TICK has been VERY mellow, mostly between a very tame +/- 500, but a few downward spikes in to the -1300 area, an extreme.

I think these minutes are a lot more important than the market may have let on.

We'll know in less than 5 minutes.

INDEX FUTURES LOOK HORRIBLE

I would not want to be long here, I don't think I would sleep at night.

Looking at Index futures and watching the averages deteriorate as the bounce off the 1/29-2/2 base has made the initial target and a head fake area target, things don't look good here.

I don't know what the F_O_M_C minutes might say, how they may be received,  as I ALWAYS warn, "BEWARE THE KNEE JERK REACTION" when it comes to anything F_E_D, it is usually wrong and usually retraced within days.

Not even Greece knows what is going to happen in Greece, but looking at Index Futures, it looks like there are more than a few big money movers that are not eager to find out that they were caught on the wrong side in addition to this being the confirmation we seek to confirm head fake moves.

If you understand that an upside head fake move/false breakout is designed to create retail demand so strong hands can dump positions in to weak hands and do it in to rising prices and solid demand so they don't push large positions against themselves, then if you recall the last posts with the rounding top or reversal process well underway, these charts will make perfect sense for where we are in the process.

 NQ/NASDAQ 100 futures 7 min

ES/SPX-500 futures (e-mini) 10 mins

 ES 15 mins

NQ 15 mins

TF / Russell 20000 futures 15 mins.

ES 30 min

NQ 30 min

TF 30 min

ES 60 min.

Like I said, I would not sleep well being long here.

Greek Drama is Getting Stickier...

I feel bad for Alex Tsipras, he's an idealist, he's most probably right and he's trying to work outside of the corrupt status quo Troika/politics as usual, he's a man that "could" revolutionize Greece and all of Europe with an amazing transformation or he could be the guy that see's Greece sink beneath the waves, either way the 40-year old politician who looks like this....


will likely look like this by year's end...

Especially after the latest Greek projections of when the country will run out of cash as no one in Greece is paying taxes, "Way to support the government you elected!"

From Kathimerini :

"The state of cash reserves – not robust before – has deteriorated further in recent days due to a shortfall in revenues, as a 1-billion-euro hole in January revenues is putting the execution of the state budget in jeopardy and hampering the management of cash reserves.

According to figures released yesterday by the Bank of Greece, in January the net cash result of the central administration posted a deficit of 217 million euros, against a surplus of 603 million in January 2014. Budget revenues reached 3.1 billion euros, against 4.4 billion in January 2014, while expenditure dropped to 3.2 billion from 3.6 billion last year.

Given these figures, the Finance Ministry estimates that cash reserves will run out next Tuesday. It has the option, however, of using the reserves of general government entities kept in commercial banks in order to cover short-term needs next week. However, the problem that cannot be addressed as things stand concerns needs for the first week of March.

Unless something changes drastically to the country’s funding, Greece will not be able to fulfill all of its March obligations."

That's enough to give you gray hair... So the Greek drama just took a turn for the worse and Germany and the ECB now hold massive leverage over Greece.

The question is will this young, idealistic government who has said they will not back down in no uncertain terms and that doing so was akin to putting the last nail in Greece's coffin, actually back down or exit the Euro-zone which would create havoc for a majority of the EU's less solvent banks and the ECB at large?

The stakes just went up, the timetable was just moved forward and not by Germany this time (Feb 27th deadline).

Early Brief

This is not going to have anything super-informative about this morning's trading action as of yet, other than the EUR/USD pair, but beyond showing it here, I'll cover currencies separately. This is more of a broad overview at this point so far.

The market does look like it's at the rounding /reversal area of what you know I believe and have believed since the base was identified and our first target was hit, to be a head fake/false breakout.

 EUR/USD losing ground on a 1 min intraday chart from overnight to present.

The 5 min EUR/USD with the breakdown in Greek talks Monday at #1 and the "Greece is going to ask for a 6 month extension" rumors yesterday at #2. The pair has given up the very minimal gains on yesterday's rumor already as of right now.

 This is a broader view of the SPY 2 min chart, I'm showing the rounding in price, the new leading negative low in 3C this morning, thus one of several reasons I believe this is the reversal process/rounding top.

I know this doesn't look like much, but that's a SPY 10 min chart and the leading negative divegrence on a chart in this timeframe is pretty serious and pretty fast, a lot of it today.

 Most of the averages intraday 1 min are choppy like the Q's above, although the Q's have AAPL really influencing them and you know how I feel about AAPL near term.

 QQQ in green vs AAPL in red so you can see AAPL is having an influence as the most heavily weighted stock on the NASDAQ 100.

 As for the Q's larger perspective, I didn't want to draw too much on the chart, but note price's rounding between the two yellow arrows and 3C's position moving down. To the far left is the last base area of Jan 29- Feb 2.

 A broader perspective of the QQQ with a 15 min chart.

One of the things I want to watch for with a range this big is whether it was accumulated as a large base for a breakout or whether it was sold in to or deteriorated, I think you can see what the 3C trend here is, thus the move above the yellow trendline would be the head fake/false breakout area, again note 3C's position relative to price to the far left.

 This is a broader view of the same chart, #1 is the failure of the market to pull off a Santa Claus rally, #2 is the failure of the market to pull off the January Effect Rally, both were forecasted in advance, that the Santa Rally would not materialize and as a result, new money would likely not be flooding the market creating the January effect, but after seeing some of the Q4 filings, it seems that this is an overly simplistic view as smart money, as 3C has been showing, has been moving out aggressively as we have seen through many areas in January. Two very recent examples from Q4/2014 filings is Appaloosa's closure of a number of positions including all of AAPL and FB, but more surprisingly, reducing their equity exposure which they had said in 2014 they had been doing for 15 months at a fund conference, by 40% in a single quarter, that's aggressive selling and Soros's $2bn SPY put position upped by 600% from the previous quarter and at its highest level since 2008 (for Soros).

 Intraday this is the only interesting chart, IWM, but it's only a 1 min chart, it's not the largest divergence, more along the lines of a bounce off intraday lows.

The IWM 5 min chart from near perfect confirmation to... Well I think it's obvious. However this is an intraday view as far as the trend view of the same chart which is part of assessing the probabilities of a head fake/false breakout...


This is the 5 min trend , the last accumulation area of any significance in December, since then, well I think it's pretty safe to say that this range has not been a large base forming area.

More as it comes in, but the main events remain Greece and the F_O_M_C minutes at 22 pm so expect volatility to pick up.

Moore in a few minutes...

A.M. Update

Good morning

It seems the situation in Ukraine is worse by the day, no ceasefire except the Ukrainian forces surrendering in a key strategic (but small) town in Eastern Ukraine after being bombarded by Pro-Russian rebel forces.

In Europe all eyes are on the ECB and whether they extend liquidity to Greece, pull it entirely, cut it or add to it, that's pretty much what the market has been in a holding pattern about for most of the night.

The F_O_M_C minutes are the other big event at 2 p.m. today.

The Bank of Japan left policy unchanged causing a little volatility overnight, but mostly keeping a choppy zone in effect.

In Asia it's the Lunar New Year with Chinese, Taiwanese and South Korean markets closed.

Futures are feeling some pressure right now...
ES 1 min chart largely in a holding pattern overnight, but feeling some downdraft pre-market.

We'll look for the news and the reaction, but I think more telling are the underlying conditions and the Leading Indicators which are finally moving, some quite sharply yesterday.

More right after the open.