Friday, February 20, 2015

Leading Indicator TLT Follow Up / Market Update

Apparently all of the intraday action, the move down and then back toward the range which would "seem" like an option expiration pin, may  not be that at all.

Greece apparently sent the WRONG letter to the Euro-group Emergency Finance Minister meeting, the one that Germany blew out of the water. Apparently the "new one" has made significant concessions, although I still can't see how they can agree to German demands. It has been called, "Going the extra 10 miles" by Greece. Apparently, they just couldn't get the CORRECT letter to the Emergency meeting, either a total BS story or gross incompetence, I'm sure the Fin-mins are all very pleased to wait for Greece to send the correct letter and I can only imagine the whispers and chuckles if indeed this is the case and not a Greek Bank run road-block.

Looking at Leading Indicators, which I normally don't like to do too early as the closing indications are the best, I don't see too much too different from yesterday. Here are a few Leading Indicators of interest...

 Commodities (brown) vs the SPX continue to diverge as they once again appear to be an effective Leading Indicator after a several year hiatus.


HY Credit continues to decline vs the SPX, a notable signal.

And perhaps the most expected of all after yesterday's TLT 20+ Year Bond Fund / Leading Indicator...  post.

As expected, TLT(20+ year bond fund) as well as 30 year Treasury futures both looked like they'd head higher, not just near term, but a swing/pivot. The evidence of that is in the 30 year yields above (red) vs the SPX which are lower as we said they'd be yesterday on a TLT move higher. This pressures the market lower as yields tend to act like a magnet for equity prices (and move opposite bond prices).

You might call a rotation in to bonds, a "Flight to safety trade".

From yesterday's post...

"Note the dates 1/29-2/2, TLT was topping, negative and then rolled over as the market was basing there and then bouncing. The current leading positive divergence in TLT suggests it's ready for another turn, this time up which means long term yields should move down pressuring the broad market as well...."

Here's the correlation between the SPX and TLT
 60 min TLT (red) vs SPX (green), it's nearly inverse.

On a 15 min chart, the market's base matches perfectly with TLT's top and downtrend, now there's a new TLT base.

Here's the short term chart, leading positive at the close and picked up where it left off with a gap up this morning sending yields lower and pressuring the market.

While I included a lot of charts yesterday, I added these like this 2 min positive because it keeps adding to the positive divegrence which is substantial.

TBT is the 2x leveraged inverse of TLT, this 5 min chart's current negative divergence is confirmation of the TLT base/positive divergences.

 This 10 min TLT is leading positive at a new high.

As is this 60 min chart.

As I said yesterday, I thought TLT was going to head higher and it has started to.

I think you can see the inverse relationship TLT has with the market implying very strongly that TLT is at a bottom and heading up and the market is at a top and heading down.

I'll continue to update additional assets as well as keep an eye on Greece, but with everything we saw this week culminating yesterday and now LT doing as expected, it's VERY difficult to believe we are not at the market's downside pivot now.

AAPL's Kiss of Death

Some of you longer term members may remember the post every so often of Goldman Sachs "Free" trade recommendation and the results of such. The first red flag in any of this is Goldman Sachs who, well who is said to trade against their own clients. Secondly I could never accept that these companies would ever give out beneficial information to you for free, they are the furthest thing from a charity, but...

If you were already predisposed to being an AAPL long and fan of the company, then how might you take their release of their new AAPL target of $145 up from $130?

Just on a random search, lets look at some past Goldman calls of this nature.

Goldman Lesson and some Odds and Ends... October 16, 2013...

"with some free advice from Mr. Stoppler, which is an ironic name because the last 6 or 7 trade recommendations he's put out have been "Stop-plerred" out. "

Back then it was another free trade that made the "Stoppler" track record 7 of 8 trades stopped out. The short USD/JPY looked and ended like this...

Stopped out and this wasn't even a trade with more than a 2:1 risk/reward ratio. The question is, do you believe that GS was actually short USD/JPY as they had recommended? Whether GS is smart money or not is not the point, the point is which side of the trade do you think they were on?

I could keep going, I believe by the end of 2013 it was 9 consecutive failed "Free" trade ideas.

So now they're upping their target on AAPL, the question once again is what side of the trade do you think they are on?

We've had plenty of AAPL posts recently: AAPL Management, AAPL Update, Quick AAPL Update, etc.

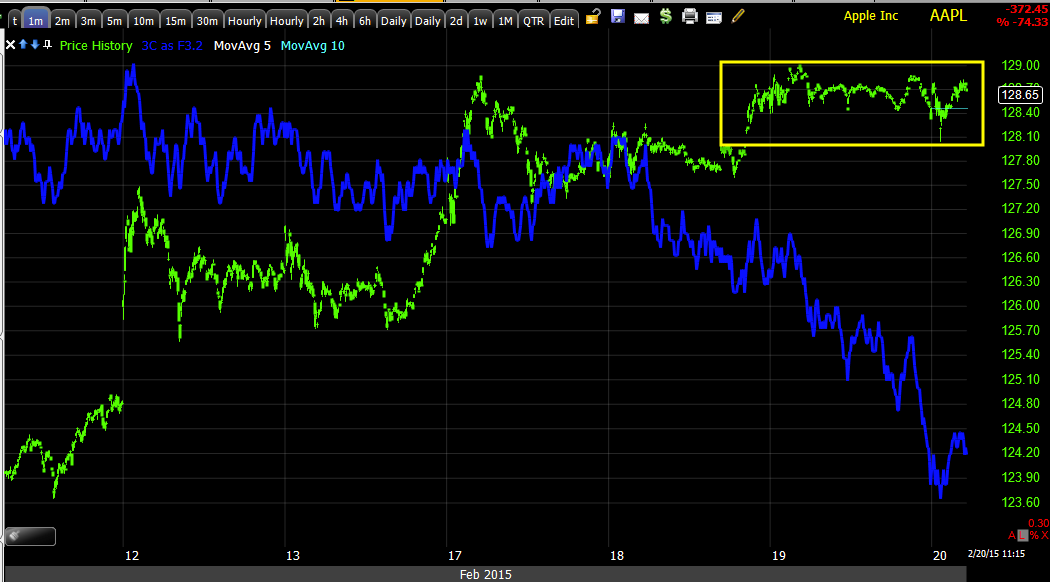
While most of the long to intermediate charts haven't changed much, AAPL also has a similar look to QQQ's Igloo/Chimney and this is what the 3C charts in that area look like...

AAPL intraday 1 min.

No matter what Goldman thinks of AAPL, good or bad, the one thing they know is that without the hedge fund heard there to provide "Strong hand support" that doesn't waver according to 48 hour price movements like retail, it's darn hard to keep price up without that institutional sponsorship and you probably recall funds such as Appaloosa closing out their entire AAPL position in Q4 2014.

We'll keep an ongoing eye on AAPL, but...  Food for thought.


Early Update

This morning's price action is surprising considering the typical op-ex behavior, but not very surprising considering everything else that has developed including most recently some very ugly negative divergences in to yesterday's close. Last night's Daily Wrap concluded as follows:


"I think you can probably sense it through my tone, but I feel we are very close to a pivot and downside reversal in the market so i'll be looking at many more assets, like NFLX and AAPL mentioned today.

I'll check on futures in a bit and see if there's anything starting to standout there.

Tomorrow is a monthly options expiration so look for the max pain pin somewhere around today's close until at least 2 p.m., after that we should have some good data, but I suspect things are going to head south and very soon."


If you are a currency trader, this week has provided plenty of volatility...
 EUR/GBP

EUR/USD

As for Index futures, they have been rather flat overnight with some slight bumps to the upside on positive headlines, more "source" rumors, but you can see how the market has opened...

ES overnight and in to the open.

As I said yesterday, there were some deep negative divergences in to the close, not just in the averages, but in a lot of places including HYG.

 As to the Igloo with Chimney top pattern which is so effective as a timing indication, with the chimney almost always directly preceding a reversal, this looks to be one in the Q's.

While not as well formed, the IWM also shows signs of one.

The idea is that the rounding top may cause some longs to doubt their positions and take some off the table, the chimney or pop above the rounding top commits them, whether they already took some off the table and add it back seeing a break higher or whether it keeps them in before the building doubts cause them to take action. Then suddenly price tends to drop, locking longs in place in a bull trap. After that it's just human nature to not accept what's happened and rather to engage in a litany of cognitive biases such as, "well the market has been up for "X" days, this must just be a small correction, maybe I'll add here to my long" and that's how it starts.

There are a few trades I'm quite interested in, some we have already recently added to, some not yet. I want to take a quick look around and make sure that this looks like a high probability pivot as well as which assets are the best looking at this moment.

UNG Breakout

Finally something different to talk about other than the very predictable Euro/Greek crisis which is best summarized by this cartoon I saw earlier this morning via Germany's TAZ,

I'll try to get to the real crux of the issue and perhaps it will be easier to understand while meeting after meeting has failed to produce even a single press release of some progress, they can't even get a draft of that out!

So UNG has broken out this morning, up +5.33%.

I hope a lot of you were able to catch this one. After our earlier Feb 10th stop run, our last update this Wednesday (Feb 18th), UNG Follow Up, said:

" On a 60 min chart, the shakeout would be below the yellow trendline which is also where the 60 min chart leads positive, in other words it looks like shares shaken out were accumulated....

Very short term, the 3 min chart is positive at the lows and in line since with some local resistance, all in all the probabilities lay with the 60 min chart, thus UNG should be able to break above local resistance"

The late fall/early winter season started unseasonably warm, however since we have obviously seen unseasonably cold  waves. In Florida it was in the 20's, I can't remember the last winter in which we had more than a couple of days at 50 and usually around 70-80.

So far everything looks pretty darn good. There's not much to update on the longer term charts since Wednesday, but the very short term charts are at confirmation or close and I have a couple of trending stops/Trend Channel for you.

 Here are the head fake/stop run moves mentioned in the last several updates. The main one was below $14, which volume makes obvious, then after setting support with a hammer, $13.50 was the next stop hit. As I said in the last update, the 3C charts show all of this head fake move under $14 as having been accumulated or bought on the cheap. Today's breakout is from an ascending (bullish) triangle-like pattern, not textbook, but the psychology is the same.
 3min confirmation...


For now, trade management is the name of the gam so we'll get this move in a Trend Channel now.

 The tighter 60 min Channel has a current stop around $14.40, I prefer to view that as on a closing basis. This stop will continue to lock in additional gains every hour. Initially a 60 min 22-bar expo moving average is "close" to the Trend Channel, but it can't do what the TC can do for long.

The larger view is that of a daily stop, now at the $13.85 area, this may be best applied after UNG gets more momentum under its wings.

So far so good, and very glad to see the move.


Thursday, February 19, 2015

Daily Wrap

Something definitely feels different about this week and specifically today, you probably have noticed I've been getting more active in putting out position ideas and I suspect more are coming.

The GREAT Greek drama continues with today's emergency meeting of the Eurogroup to review the latest Greek proposal asking for a bridge loan, not new terms to the old bailout that they expressly don't want to continue in any way, shape or form. You also know what the Eurogroup/German position was... If the Finance Ministers of all of those countries gave me 1% of the gas, food and lodging they spent to go to Brussels to review the Greek submission, I would  have saved them 99% and be a rich man with the simple word, "Nein", not going to happen, why waste the time?

However once again, according to not 1, but 3,  "Sources" the Finance ministers or some portion of them and the Greeks have drafted a statement to serve as the basis of compromise which is to be reviewed by all Finance Ministers in Brussels tomorrow, the "Sources" sounded relatively optimistic, however how many of these sources have we heard of (never with a name) and how many times have they been right? ZERO (at least to the question of how many times they have been right).

In what I can only see as a further divide as the US today had our Treasury Secretary, Jack Lew call for the toning down of rhetoric between the two sides as apparently the US can't keep its nose out of anyone's business whether it be in the EU, your work-place, your Doctor's office or bedroom.

ZEEE Germans leaked a letter purposefully stating the 3 requirements Greece must agree to in order to reach a deal which included: 1) a CLEAR and CREDIBLE request by the Greeks to continue on with the current program which is a non-starter, 2) They will agree with the lenders as to any changes the lenders make 3) They will commit to fulfill the terms and conclude the program.

Additionally, any of the reforms Syriza campaigned on like labor reforms the Troika insisted on that have punished the working class in the name of austerity and social reforms all of which are to be voted on in Greek parliament this week will be rolled back, they will take no action that is at odds with the agreed upon austerity measures which is the basis of Syriza's entire campaign, basically Germany is saying, Alex Tsipras, you will renounce EVERYTHING you believe in and you will act like a good puppet / Goldman Sachs alumni/ Papademos.

If this ever gets resolved, I can't wait to hear what the terms are, I just can't see it though, I really cannot.

As for the averages today, a pretty lack-luster day except for the NDX which looks like it's forming the Igloo w/ Chimney top that is so often seen and Transports acted horribly today.

The Q's closed up almost half a percent while the R2K was flat, the SPX and Dow slightly in the red and transports slightly red, but look at transports intraday (salmon), they didn't act well at all after the a.m. session.

Crude bounced a little today, I think it makes another strong second leg higher, but I still think a slightly deeper pullback is probable. Gold and silver were down which is not a surprise, but they are also closing in on what looks like it will be an upside reversal in the not too distant future.

Treasuries also look close to rallying which means the market would almost certainly move down, see today's TLT update. We did successfully trade TLT long last year with some leverage and did pretty well, I'm not sure I trust the same trade now, maybe something shorter, but there are likely better assets/choices, depending ion your needs.

The afternoon and end of day trade saw sharper negative divergences, they seemed a little subtle at first, but they were indeed sharper and HYG saw a sharper negative divegrence short term, the longer term is negative and it also saw and EOD decline in to the close.
 Intraday HYG sharp negative divegrence.

HYG's larger trend (60 min) sharp negative divegrence

HYG's sell off in to the close from an already "red" position.

And HY Credit vs the SPX intraday today.

 This HY Credit divergence is EXACTLY the kind of divergence we look for in Leading Indicators to serve as a signal that the market is near a turn (down).

Additionally, pro sentiment is showing the same kind of divegrence we look for vs the SPX, also showing a negative signal for the market.

Yields were a non-factor today, but with the TLT charts looking as they do, I suspect they'll be headed lower soon, pressuring the market lower as well.

Commodities, if in fact they are acting as a leading indicator again as I suspect they are, diverged even more to the downside vs the SPX today.

As shown earlier, there's a lot of confirmation in leveraged market/sector ETFs and their inverse ETFs which is another thing I look for, multiple asset and timeframe confirmation.

As for the internals, the custom NYSE TICK indicator show internals getting weaker.
This is the entirety of the most recent cycle, note the TICK data falling off rather than increasing as it should in to higher prices or in the area of them.

As for other internals, of the 9 S&P sectors, 5 of 9 were green. Tech led at +0.35% and as I mentioned earlier with regard to financials and tech and leadership or rotation, yesterday's leader, Utilities was today's biggest laggard at -1.13%, this is a fairly common theme.

Of the 238 Morningstar groups we track, only 107 closed green. There was NO Dominant Price/Volume relationship today.

I think you can probably sense it through my tone, but I feel we are very close to a pivot and downside reversal in the market so i'll be looking at many more assets, like NFLX and AAPL mentioned today.

I'll check on futures in a bit and see if there's anything starting to standout there.

Tomorrow is a monthly options expiration so look for the max pain pin somewhere around today's close until at least 2 p.m., after that we should have some good data, but I suspect things are going to head south and very soon.


Leveraged ETFs Cont.

Here are some quick examples of leveraged ETFs giving not only some strong signals, but giving very nice timing signals as well.

 Sharp intraday leading signal in SRTY/ 3x short Russell 2000.

URTY is the opposite of SRTY, 3x long Russell 2000, for a 1 min chart it wouldn't be my first choice because of the volume, but intraday you can see the equal/opposite leading negative at the close.

 Here's another sharp signal in the timing chart of SRTY 3x short Russell 2000. Note the negative divegrence,  IT'S TOP/PIVOT IS STILL THE EXACT SAME DAYS, 1/29 THROUGH 2/2 and in between the 2 divergences is an inline signal with the trend.

This is SRTY's longer term 30 min cha, it's in a large leading positive position.

URTY's 30 min long term chart is virtually equally the opposite...
3x long Russell 2000 (URTY) 30 min.

While I can post these charts all day as they are all confirming, it's some of the near term charts that are most interesting. Before I was using 3C or understood it well enough to use it effectively, I use to spend hours every night going through hundreds of stocks, usually spending less than 2 seconds on each, I was watching my indicators and getting a feel for whether there was an overwhelming theme among a watchlist and that would give me an idea of what the market was about to do, using multiple timeframes and multiple assets with 3C as well as other indicators has more or less replaced that lengthy process, but the idea is the same, since the inverse ETF has its own volume (demand) even though price moves directly inversely, the signals will only confirm if there's something really to the charts.

Here are a few more examples...
 SPXU (3x short SPX-500) and its intraday timing chart , again with a top right at 1/29-2/2 and a strong leading timing positive signal now.

Contrast to it's opposite ETF, UPRO 3x long SPX-500

 The same intraday chart is giving the exact opposite leading negative signal, that's confirmation between multiple assets, not just the S&P ETFs, but the IWM ones as well as what's below...

 The long term 30 min trend or the stronger depiction of money flow, negative at the same top at 1/29-2.2 and leading positive now and a large divergence for a longer timeframe like 30m.

 UPRO- 3x long SPX-500 on the same timeframe with a base at 1/29-2/2 and a leading negative divegrence similar in size and scope to SPXU's positive.

 SQQQ 3x short QQQ/NASDAQ 100 1 min with a strong leading positive intraday timing divergence.

TQQQ, the opposite- 3x long QQQ 1 min with the confirmation signal of a similar leading negative timing divergence.


SQQQ's long term underlying flow on a 30 min chart with a huge relative and leading positive.

TQQQ in the same timeframe with the same large relative and leading negative.

I mentioned FAZ and my belief that Financials bounce tomorrow with FAZ pulling back in what I think will be an excellent buy area or add to. This may be a rotational set up as Tech clearly led with small caps unchanged, the SPX basically unchanged and large caps down a bit. Tech led about the same amount as Financials lagged. If you have paid attention to our S&P sector performance, more often than not, today's leader is tomorrow's laggard and vice versa. 

Here's a potential play beyond just a long which I think is about as close to ready as I'd be willing to cut it.

I'm going to show you FAZ 3x short Financials and FAS 3x long financials and make the case that FAZ looks ready to move to the upside, a small pullback tomorrow would make for an excellent entry so we'll start from the long term charts and highest probabilities and work to the intraday timing with confirmation via FAS, the signals should be nearly exactly opposite for confirmation.

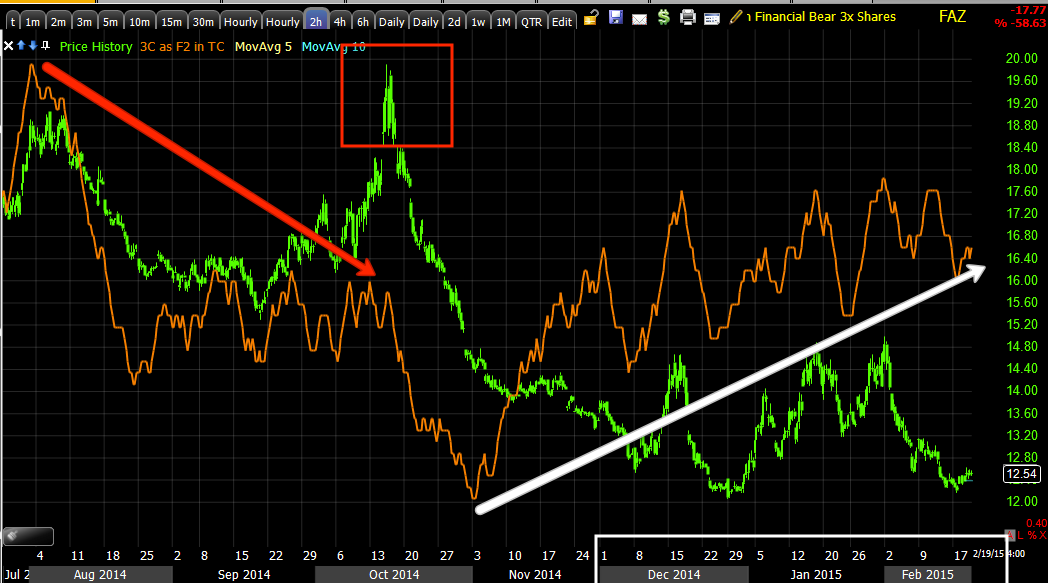
 FAZ 3x short Financials 2 hour, just follow the divergences from left to right.

FAZ 30 min which is more of a timeframe for this cycle. Note the dates of distribution.

FAZ 15 min which is again a built up area of 3C accumulation telling me that FAZ looks ready from a strategic view to move to the upside, it has gas in the tank.

The FAS (3x long) 15 min chart is nearly the exact opposite, also note the Igloo/Chimney(upside down) at the base from 1/29-2/2, it's more just about a head fake move and how they can be excellent timing. If you think about the psychology of how traders react, you can understand why they are so prevalent.

 FAZ's timing chart at 2 min going all the way back to the market's last base.

And FAZ's 1 min negative in the afternoon today, since this isn't on a 2 min chart, it shouldn't be that strong of a divergence or move, but enough for a small pullback which should be able to be used for either a long position or what I'd prefer, a call position in to very short term price weakness with good timing.

FAS 1 min should confirm...

And it has a positive afternoon divergence as well.

XLF 1 min doesn't show any divergence (positive) like FAS although it should, but as I said, often leveraged ETFs show divergences that the underlying doesn't when it comes to finer details.

XLF 1 min.

FAZ 1 min. What I'd like to do is use the weak negative signal that should rotate financials tomorrow and pull FAZ back a little to enter a call position, whether FAZ or more likely XLF, this is because it's a very small, short term signal being it's not on XLF and it's not even on a 2 min chart. It should provide a discount on the call and an edge.

Overall though, between all of these ETFs both leveraged and inverse leveraged, there's a ton of confirmation from long term right down to very near term timing charts.


Leveraged ETFs / FAZ

There are some pretty strong signals coming in on some of the leveraged ETFs, for whatever reason, these often give earlier or stronger signals than their non-leveraged counter parts.

SRTY for example, the 3x short IWM / Russell 2000 is giving a very sharp leading positive divegrence on intraday charts and in good shape on others.

One I noticed was FAZ/FAS. FAZ looks to have bottomed on the 17th, it has a 1 min short term negative and FAS (3x long financials) has a 1 min positive. I think Financials see some upside tomorrow, it will likely be an excellent FAZ entry, although we want to confirm that , but more and more of these are showing the kind of signals that are jumping off the charts.

If you're interested, FAZ may be at a pullback/discount tomorrow.

I'll try to get some of the other examples up soon.