Thursday, March 5, 2015

GPRO Trade Set-Up

All I keep seeing everywhere is the market is not a bubble, "This time it's different", the managers who have reduced their equity holdings or completely dropped them, the insiders buying back company stock and selling their shares and now the latest in a long line of "This market is a bubble", Mark Cuban.

However one of the moments that will stick with me the rest of my life just like at the 2007 top, was on CNBC yesterday, I didn't see it live, but it's such a textbook example of the "Irrational Exuberance" found at market tops, which I'd much rather hear than a bunch of well respected guys calling a top, the market tends to like to surprise people.

In any case that brings us to the flop that has been GPRO as it has essentially round-tripped in less than a year. I don't know much about their product, except I got a Polaroid version of the "Action" type camera, water proof, small, can mount to anything and takes High def pics and vids and while it may not be as good as a GPRO, it's half the price or less and it's darn good for me as far as surfing, snorkeling, taking underwater captures of my reef tank or just an easy camera to carry around in my pocket with a cool wide-angle lens.

All of that being said, no one cares, it's which was is the stock going and GPRO doesn't exude confidence on my part any time in the near future.

Thus, my earlier post about a GPRO bounce probability and trade set up, I'd personally let the trade come to me and that means let it bounce if it can, if it can't, no harm, no foul, it's an idea that didn't pan out with nothing on the table. However if it does see a counter trend move/bounce, then it looks like a fantastic short set-up because GPRO doesn't have to stop at its IPO issue price, it can theoretically go to zero.

Lets get to the charts and the idea...

 At least this is one decent example of how volume should look in a rally. At the white arrow, volume should increase with price, that hasn't been the case under the QE regime because money was just being dumped in to banks and the market by the F_E_D, but it seems like the important basics like volume analysis  which a whole new generation of traders have grown up knowing or caring nothing about, is coming back with a vengeance and will give you an edge even with a basic understanding.

While I may not be correct in drawing a Descending Wedge on the chart as volume is not correct for such a formation and for other reasons, I do think the narrowing price range will act similar to Bollinger Bands that are squeezing and cause a highly directional move in price, that doesn't mean the move will stick, but this concept has been around for a century in TA from consolidation patterns to tops and bottoms. T

The heavier volume near the lows in yellow is somewhat indicative of a capitulation event. I believe it was just yesterday in talking about volatility that I mentioned that a capitulation event is usually not the bottom although many consider it the end of a trend, we typically see price drift lower for a period  before a bottom is found and in GPRO's case, it may very well just pop and drop, that's the trade idea any way.


 The daily 3C chart shows that the buyers and sellers were pretty transparent about this one, they got in, they got out, not too much in the way of game playing and the daily chart is confirming price action for the entire chart, note that it is not showing any kind of divergence that would suggest GPRO is finding a true bottom.

 You know my custom DeMark inspired Buy/Sell indicator and you can see the buy/sell areas in red and green . You can also see a MACD Histogram divergence, typically you want 3 divergences with this indicator before you get a move or reversal which is what we have.

However while they have diverged on the lower end of the histogram, they have not increased on the upper end as I drew in white on the right side, so this again tells me a pop and drop would be a likely outcome.
 This is the same indicator taking it a step further to a 60 min chart, while there's no current buy signal (which I probably wouldn't do any way, at least the way it looks now), that may develop giving us a better handle on timing.

 The 60 min 3C chart does reveal some divergences as it is more detailed than the daily. I tried to mark the positive and negative divergences by appropriate size, again note there's nothing strong or positive at the local area so once again I see this as more of a pop and drop set-up and I'd much rather short the drop than buy the pop, but if things change, I will change with them.

 On the 5 min chart we see some divergences and an interesting looking positive recently, rather strong for the area, but I don't quite see the base yet which is of little importance to me at this point as I'm not interested in the buy side, I'll simply set upside alerts to let me know if it has moved and then I'll look for the trade set-up/entry.

However once again, if the dynamics change and the long also looks like a decent trade, I'd certainly be happy to take two trades rather than 1.

 The 3 min chart is more of a timing chart and it is starting to develop as well. I'd rather see stronger signals here as far as timing, but once again, all I really need is upside price alerts unless the bottom area starts looking better for a potential piggy back trade.

And the 1 min chart. This chart should really shape up and give a decent signal before any solid bounce, but once again at this stage it doesn't matter, I just need upside price alerts to let me know if the move up has taken place, then the work starts of looking for an entry and making sure there's distribution in to the pop, confirming the trade-set-up.

So I'll keep this on my watchlist just in case the bottom area does improve and is worth consideration as a short term long or call play, otherwise, I'd just set some price alerts above the upper trendline of the descending wedge I drew, in the $45, $47.50 and $50 area.

GPRO

I think GPRO sees a counter trend bounce, while I'm not very big on playing the bounce side of things, this would set up a nice short in GPRO.

Additionally other assets I'd be looking at include AAPLm and NFLX, both of which have been moving down since our recent trade ideas in them, a counter trend bounce in either of those and I'd be all over it.

I'll bring you GPRO today, I do think it gets that bounce. While I wouldn't say the market looks especially strong here or ready for a bounce, I doubt GPRO could get too far without at least a moderate market. I'll look in to that angle further and as I said I'll be posting GPRO.


Gold / GLD Update

As you know, we called for a pullback in gold/GLD in late January expecting that we would see a constructive pullback (accumulation). So far we got the pullback, we even have signs of accumulation and what I suspect is a "W" base about 1/2 way complete, maybe a bit more.

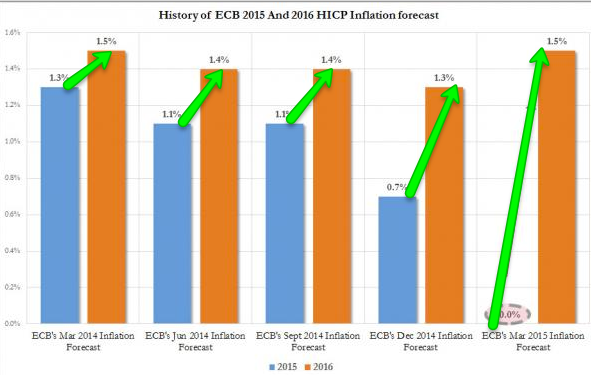
What I don't understand and it's not all that important that I do as I'm not privy to insider information, is why gold would be an asset that would gain in value when all indications are generally pointing toward deflation or at least the perception or fear of deflation except in Mr. Draghi's case who forecasts inflation to go from 0% in 2015 to what they call a "Hockey Stick" save or recovery and print 1.5% in 2016, to give you an idea of what that would look like...
That's a pretty wild ride isn't it?

OK, so maybe Draghi knows someone in OPEC and knows exactly what they are going to do as the downward revisions to ZERO have been blamed on cheap oil, to me it seems like one of the wildest, unsubstantiated guesses a person in that position could possibly make.

However, the market is about perception right? It's just the perception about Mr. Draghi is not exactly one of trust and commitment.

The reason I mention this is that usually gold is bought on the EXPECTATION of inflation and with central banks mostly coming out on the side of, "Near term we expect more deflationary pressures" (not suggesting outright deflation, but the lowering of inflation expectations; the F_E_D has done it, the ECB certainly has done it.

We know that the F_E_D needs some excuse to say they expect inflation to move toward their long term goal of 2% so to get done what I think they need to get done, inflation has to start to ramp up so maybe Draghi and the F_E_D know something that we don't whether it's real or subterfuge.

Or perhaps there's something else to it.

In any case, I just follow the charts.

 This is the chart showing some accumulation to the left ad a rally off that in to a negative divergence which is the area in which we called for a gold pullback which has happened since.

You might be very tempted by the 30 min leading positive divergence since the pullback has gone lateral (typical base building or a reversal process), but I'd probably let this play out a bit longer,

Take a look at price inside the white box, does it not look like the common "W" bottom could form with a slightly deeper pullback to the recent former lows inside the box? To me it does, which may also see a head fake move below defined support by the time such a price pattern were in place. Assuming that were the direction GLD was moving in, I'd want to be long on the head fake below the support level of the "W" pattern, not only for the better entry and lower risk, but for the excellent riming cue head fake moves give.

 On a 10 min chart with more detail ( a bit more noisy), we have the exact same trends, positive in to a rally and a negative divergence in to a pullback which is seeing positive 3C activity as price has transitioned from down to lateral. In cycle terms that would be a stage 4 transition to stage 1 base within a sub-intermediate to short term trend.


 The 5 min chart shows near perfect downside confirmation on the pullback after the negative divegrence and a clear positive divegrence since price started moving sideways.

On a 2 min chart close up, you can see the near perfect downtrend confirmation by 3C with each little upside pop shot down.

 This is the same chart zoomed out. Again, the same trends are evident from accumulation to distribution to pullback, but here we don't have the accumulation of the longer charts, that's because the longer charts represent what I would call the strategic outlook.

When the short term charts start going positive, they are showing us timing or what I'd call the tactical outlook , the area and time we'd consider an entry, so I don't think we are there yet for more than 1 reason, but I think we are going there.

 I did take a quick look at Gold futures (YG) and I see confirmation. This 10 min chart shows the same downside confirmation that the GLD 3C charts show.

This longer 30 min chart shows the same continues pull back and in line status, at least until there's more work donee in the area and stronger signals, I'd be patient, but I do think we'll have an interesting trade to consider soon.

Another Market Pin (MCP Quick Update)

Today's trade action beyond this earlier update Quick Catch-up going in to the European close at 11:15, there hasn't been a lot of movement in the charts, reminiscent of yesterday's underlying action and the day before.

Take a look...
 Other than the earlier post with a negative divegrence intraday (SPY), it has been nearly perfectly in line.

The exact same holds true for the Q's

And the IWM.

Again it looks like the market is in a holding pattern like yesterday waiting for today's ECB meeting, considering 3 surprise easing actions yesterday and the anticipated QE from the ECB today with some pretty amazing upgrades to their economic forecast all things considered, I do find it strange the market hasn't made a significant knee jerk move , especially on the 3 surprise easing actions yesterday.

It seems we are in a much different environment than 6 months ago as far as the market's reaction to monetary policy, specifically easing.

I suspect if there is a holding pattern, it has everything to do with tomorrow's Non-Farm Payrolls at 8:30, although we do have a weekly options expiration as well and the max-pain ppin that usually comes along with that.

I took a look at Short Term VIX Futures (VXX) and it too is in line intraday, not being pressured lower here.

The overall trend though is as I would expect for the stage we are at in this cycle, thus I like the 2x long VXX ETF, UVXY.

I also checked in on TLT which I have expected to move higher the last 2-days as we closed the short term short position (it was nearly a  scalp trade when presented so it wasn't expected to last long), but TLT higher would also make sense for where we are.

The one thing I did notice was HYG intraday making a little run higher making me wonder if there's going to be a ramp attempt in to the close, although thus far I don't se the additional levers of VXX and TLT being bothered and I don't even see an HYG positive divergence, I'm not even sure if this small intraday move will hold.

So, there you have it, right now we look rather pinned down and in a holding pattern.

I'm going to devote a few more minutes to market analysis and check on a couple of Leading Indicators, then I'm going to spend the rest of my day on individual assets.

A few of you have inquired about MCP, the last major post we had on MCP was February 17th, MCP Alert in which the following was the gist...

"I think it may be time to take some or all of MCP off the table for now... The 30 min chart looks like there's a lot more gas in the tank, but also that a pullback is likely here, at least a pullback."

To that end of a potential new position as a pullback either resolves constructively or not, this is where we stand...

After a +300% move off the January lows, we exited on the 17th right at the top and decided to wait to see what a pullback (or...?) looks like.

I've been keeping tabs on MCP because so many are interested in it. While there are some interesting developments on this chart, there are several other charts in the "timing" range that I'd want to see move before I posted a Trade set up, but I am watching it and there has been movement, just not at high probability/low risk quite yet.


UNG Nat Gas Update

At the end of November we expected a pullback , mostly along the lines of a gap fill, but despite how cold this winter  has become, Fall and right in to winter was an unseasonable warm trend, one we accounted for in some December posts mentioning that the actual winter season was not even yet upon us which is December 21st.

UNG pulled back more than the expected pullback from the late November posts, however it is looking interesting again.

Today's EIA Nat Gas report came in...
Consensus expected a draw of 222-226 BCF with the actual coming in at -228, a bit more than consensus and about 9 bcf more than the prior.

Here's where we stand with UNG/UGAZ...

 This is one way of looking at UNG, one which we have seen some stop runs, some accumulation on them, what looks like a head fake above a an ascending triangle (bullish consolidation price pattern so a head fake wouldn't be surprising) and a 3-day Harami or "Inside Day", with volume events around all of the candle sticks.

Another interpretation of the above specific movements would be to re-draw the trend line in a much more basic fashion.
 This looks a whole lot more like an Inverse H&S price pattern. The failed breakout earlier in the year is something I can't give you an answer on, it had good looking volume, a good looking candle, but perhaps it's more telling in what a failed breakout would tell retail traders, "Move on" which would give Wall Street UNG essentially to themselves at what is a low end of the range and a steady one at that, typically seen at accumulation and distribution points (depending on the preceding trend).

 Here you can see why we called for a pullback in November to the far left and there's a lot of consistiency in the charts on both that signal, and the leading positive in the area of what looks like an inverse H&S base.

 This 15 min UHG chart confirms the exact same, negative in November and positive going in to this range which is at the lower end of the range for Natural Gas prices.

The very recent increased upside ROC in 3C caught my attention as well.

This 5 min chart offers more detail, a positive that looks like the lower end of the range is being accumulated and the upped end is letting out some supply to send prices back to the lower end where they appear to be on a solid accumulation trend. Again, the recent increased positive signal of this month draws some attention.

 Once again, the upper end of the range sees some supply let out and as UNG moves lower that supply is absorbed with an interesting, stronger than usual positive divergence recently.

Note there is no negative divegrence right now on the 2 min chart.

 The 1 min chart confirms this trend I believe is in effect, accumulating on the low end of the range, in other words a classic base. However on the 1 min intraday, there's some distribution since the EIA report, I doubt it's the report, I understand weather is suppose to moderate until March 12th, that may be one more run to the lower end of the range, but I can't say on just a 1 min chart, if I saw the divergence migrating to 2 min and longer charts then I'd say that's probable, but I think it's probably too early to see that.

I checked the NG futures, this 15 min chart is in line with price like many of the other charts in this area, confirming.

The 5 min chart shows nothing other than confirmation as well, which is what all of the UNG chrts show in the same area with the exception of the 1 min. As I said, it's too early to tell if that's a simple intraday signal or will become a larger pullback toward the lower end of the range again, but what does look clear is this large, flat range that looks a bit like an inverse H&S base, does have a very strong long term signal confirmed throughout all of the charts.

I'll follow UNG to see if there's any migration from the 1 min chart to anything longer, but all in all, I like what I see, even if it were to pullback to the lower end of the range 1 more time which I can't say with any credibility at this point that it will. What I can say is the larger picture here looks pretty interesting for a move or breakout above the $15 area soon.

I'll keep you posted.

CLOSING HALF OF AAPL MARCH 20TH $130 PUTS

I'm taking half off the table for the moment, just because the move is a little too parabolic for my liking, but will keep the second half in position, perhaps add to it at some point.


Market Update

I just wanted to mention something first before the update. I've had numerous employees or people under my management for years, I know that generally speaking when they are quiet or "not around", they're off smoking in a broom closet or on their phone around the backside of the building.

With me, when I'm quiet (posting) it means I'm busier than usual, tearing through charts, brainstorming, etc. The truth is I can't make a cup of coffee without bringing a laptop with me and those of you who know Andrea ( a few of you) can ask her, when she gets home, other than a brief "hello, how was your day", we don't talk or do anything until I've finished my day as I want to devote all of my energy to the work without distraction and when it's done, I devote all of my energy to Andrea without distraction.

In any case, I know I've been a bit quiet today, so although I know a lot of you know this, I just wanted to be clear that my eye is on the market all of the time.

OK, now that I got that out of the way... Yesterday I posted this article, Market Expectations and Volatilty and I hope you had or will have a chance to read it.

The important part right now for me is "The right tool for the job". One of the charts that is screaming and the kind of chart that I never ignore as these signals are not usual is the ES/SPX futures 60 min.

I couldn't get the entire cycle from 1/29 on the chart's histor, but it starts at 2/4 which is close and I think the signal is very clear. Over the past couple of days since the UVXY long on Monday, I've had to make decisions about whether the position should be closed and re-entered taking a 6% gain the first day and nearly an 8% gain yesterday (the second day). 

What I was trying to get across in that article is = the fact there's going to be volatility in a market always, there are going to be false moves or the jiggles always, but it's important to match your trade and trade plan with the trend or signal you are following, for me this is a bearish trend signals so I don't want to be trading in and out of positions on a daily basis and I don't want to worry too much about any intraday or day to day volatility as I know it's going to be there and increase. I think that's one of the keys to successful trading, as you know I don't endorse ay one particular style, it's what fits you , but I do endorse that whatever that style is, you plan your trade and trade your plan. I have no intention of getting kicked out of a trend position based on this chart over an intraday move or a 1-day move.

We expected early strength in the week (Monday) and weakness to follow, I would have made a big mistake to close a short position on Monday's action considering the above chart. This goes for intraday trading as well or any kind, match the tool (trade) to the job (the environment and timeframe).

As for the market update, the last post with a signal was a very clear one, thus I posted it. Two big mistakes I have made and I suspect most traders, are 1) Trying to force information out of an indicator when it's not there. Just be patient, it will show.

2) Trying to force a trade when the edge is not there. I know this better than most as I gave up a 6 figure a year job to trade, which did not go over with my wife at the time who came from a country in which you work at the same company your entire life, you keep your head down and collect your pension 20 or 30 years later, you don't give up that security to trade for a living with no other income coming in and the "cushion" going in to the trading account.

She would ask every day when she got home from work, "Did you make money today?"and there was no good answer, if it was "no", then the "How long are you going to do this conversation started and if it was yes, the response was, "Oh that's good considering you didn't make any money yesterday".

In other words there was no winning, but it caused me to make some silly trades, to try to force something to happen when I should have been patient. After we separated, I started trading my own way without the pressure and things were immensely better.

Again, right tool for the job and don't force it, that goes for swinging for the fences trying to make up a loss. If you are in a hole, STOP DIGGING! We trade on an edge, not on a roll of the dice that means take emotion, take ego out of it.

That said, this is what the market update is looking like thus far since the last update with a negative divergence.

 SPY intraday trend since last Friday when we expected some early in the week strength and mostly decline through the rest of the week, you can see how 1 day, even intraday trade on Monday "could" have scared me out of positions that were/are longer term in nature, as far as that 1-day goes, it's noise vs the trend above on that 60 min ES chart.

Right now the SPY is a hair from a new leading negative divergence.

QQQ also showing Monday and the 3C and market trend lower this week so far. There will be jiggles like Monday, that was part of the point of yesterday's post, put them in context with your trade and trade plan.  Turn off CNBC which just made my "Moment in time " memory for this market, just like the 2007 push of the book "Dow 20,000", I'll get to that later.

Intraday QQQ, you can see it's very close to a new leading negative divergence. I posted the last divergence because it was already at an edge, we are not quite there,, but very close intraday.

IWM intraday, again you can see why I posted the earlier negative divegrence, as for now, close, but not quite there. The 60 min ES chart tells me the probabilities are highly in favor of "we will get there".

And the IWM trend view, again the action leading in to Friday was negative, the bounce on Monday for all intents and purposes, noise for my longer term trend perspective and as you can see, just a hair for a new leading negative low.


Quick Catch-up

*Intraday market update at the bottom*

There's a lot to go through today with China really coming out with a surprising admission of what the global economy has already been reacting to for sometime now.

China, one of the most economically (and otherwise) opaque countries in the world came out and admitted things were not just going south, but the entire country's structure is for lack of a better word and I appologize, "Screwed".

Oil did exactly as I suspected and gave up gains, while China was certainly the catalyst to move that ball, I think it would have happened any way, this doesn't change analysis in USO which is still on going, but it changes a lot of other things, for example, China is Europe's biggest trading partner and considering Draghi's very optimistic GDP revisions and inflation revisions, one has to wonder how he can say that without a sinking feeling that any credibility he may have had, just poured out of his mouth on to the ground.

TLT is doing as suspected, although this in the context of a global bond movement virtually the moment Draghi started talking, as a reminder to yesterday's Treasuries/Yields Leading Indicator Update post, Treasuries/yields are MATERIAL to market analysis  and while most of you understand why, I'll sum it up in a single chart...
The SPY since the Feb 2nd cycle started and 30 year yields (although we can use 5 or 10 year as well, it's just easier with TLT analysis) in red. Yields move opposite Treasuries/bonds which as I just mentioned, popped as soon as Draghi started speaking, something which we expected in TLT as of yesterday's update Treasuries/Yields Leading Indicator Update although this was more of a general analysis of TLT rather than anything specific to Draghi.

The point is yields tend to pull equity prices toward them, with a rally (which may be a bit too soon as it just popped this morning), yields fall and as a result, that pressures the market lower in a place where almost all of our analysis is already pointing LOWER.

Unfortunately, any one of these subjects and the knee jerk effects as well as the strategic effects could take up an entire day of posts.

If you didn't hear, this is a snapshot of the overnight developments in China while I'm waiting for the UNG knee jerk off just reported inventories to subside.


China Lowers Growth Target to About 7%

(If you have a problem getting the article and a note about subscription, simply Google the title of the article above and you'll be able to read it without a subscription)

Some bullet points from multiple sources...

Premier Li Keqiang set a downbeat tone as he set the economic growth target at ‘around 7%’ from ‘around 7.5%’ last year. 

Additionally noting, (this is where I suggested the tone was that of the entire country's "Structure is screwed..again my apologies for the vocabulary) ‘China’s economic growth model remains inefficient; our capacity for innovation is insufficient, overcapacity is a pronounced problem and the foundation of agriculture is weak’.

The risk from Deutsche Bank's perspective is China experiences a "mini-hard landing" this year.

Li put the slower economic growth in terms of, "The new normal".

I'm sure if you read the article, you'll note a very somber tone from Premier Li.

As Europe's largest trading partner, I think you can see how this effects the credibility of Draghi's very optimistic GDP forecasts, even when he himself has noted that QE will accomplish nothing without EU countries making structural reforms which he has been pleading for for years, this at a time when the anti-austerity or "structural reform" movement is gaining momentum avross Europe. Syriza's rise shows that momentum and thir failure, as suspected was largely the very heart of Europe being threatened and had nothing to do with Greece itself, but European banks.

Just yesterday,  the IMF director Batista (part of the Troika) admitted the Greek Bailout was to SAVE German and French banks. What could possibly go wrong in the EU?

 Transports have not confirmed the Dow for you purists.

In any case, this is some of the background the current market stands and events are coming at us fast and furiously. It's not my job to be a news source, I'm terrible at that, but it is important to understand how one thing effects another or the butterfly effect rather than just hearing each piece of news, putting together probable outcomes and testing whether the market is discounting these, that's more my job.

In any case, I'll have as many updates as I can get out there for you as well as opportunities.

Thus far, the market is not surprising considering the staging and signals.

SPY intraday...

 SPY 

QQQ intraday

IWM intraday

So far, the continuation of the Week Ahead's forecast for weakness...


UNG -Pre EIA Report

The Nat Gas report for this morning will be out at 10:30. There has been a recent minor trend pullback and what is looking like a large base , but most importantly, since the pullback from Feb 23rd, UNG spent much of last week putting in positive signals which is what I like to see on a pullback and more recently this week, very strong timing (short term chart) signals which it has moved up from, a little too parabolic this morning for my taste, but up.

I'll be posting just after the report settles down (after the knee jerk), because right now, UNG is looking very interesting.

A.M. Update

OK, so the market was in a holding pattern to see what the ECB was going to do, which so far has been nothing short of uneventful.

Rates were held in place, the widely anticipated ECB QE program will begin March 9th, even though there's not enough net issuance for the ECB to even buy, but Draghi has always been a talker, I never said a good talker and that's why the half-life of his comments has dropped over the years from that of a Central Bank leader to that of the town crier.

ES looks like this right now and I suspect it's because Draghi has a credibility problem...
ES with a negative divergence in to the Draghi press conference.

And what might be the credibility problem?

Draghi and co. raised 2015 GDP expectations from 1% to 1.5% out of thin air or out of QE and all the wonderful things it will do for Europe despite the fact there aren't enough assets to buy and Draghi is still pleading and telling everyone, even this morning, that this is all good for naught if there aren't structural reforms which he has been talking about for years now. Mr. Draghi, there are no structural reforms, there won't be any structural reforms and there's absolutely nothing you can do about that so you have admitted that QE WILL NOT work without them and you know they aren't coming, how do you get to 1.5% GDP from 1% for 2015?

But that's not even the worst of it. In December the ECB cut inflation forecasts from 1.1% to 0.7%, then in March cut them again to ZERO! Almost DEFLATION and why? Dropping oil prices of course.  2016 was reduced modestly from 1.4 to 1.3.

However in the ECB's/Draghi's opinion, they just took 2015 and left it at 0% and raised 2016 ro 1.5%.

Does Draghi have a crystal ball with regard to OPEC since the inflation forecasts are based on oil prices because he made one heck of a prediction or oversight, 2015 inflation to go from 0% to 1.5% in 2016, that's one exceptional move.

Additionally 2016 GDP was raised 1.9 vs previous of 1.5 and 2017 was added as a new data point at GDP of 2.1%

And Europe's biggest trading partner is China who has already said that this year will be worse than last?

Mr. Draghi's leisure time listening music...

Oh and by the way, Initial Claims just came in at 320k vs 295k consensus, this is now the worst start to the year not only for macro data, but now Claims since 2009, tomorrow is the big one, Non-Farm Payrolls at 8:30.

Enjoy the song, it really is appropriate.