Monday, March 16, 2015

Leading Indicators and Perspective

Not to get off track right off the bat, but I see German Finance Minister (The Smeagol of EU Finance Ministers and the one guy who is as nasty as he looks) Schauble has come out and said he "Doesn't know what to do with Greece Now" and that the Greek government has broken ALL trust that had been rebuilt.

Has anyone been watching this thing unfold day by day? I think Greece should be the market's leading indicator. If you have any political ambitions, go to Greece; apparently the bar is EXTREMELY low. Honestly, without exaggerating and most of this stuff you couldn't even make up, one day the Greek government is promising to destroy the Troika, that they will not even consider talks about the bailout, the next they are signing whatever is put in front of them and even written in their names by the EU and in a worse position than when they started, then they are defiant again or throwing ideas like arming tourists with video cameras to catch Greek tax cheats, the idea being no one knows who might be a "non-profffesional "Tax spy", which the EU? shoots down as the baloney it was, then they are defiant and will default inside the EU without an exit, then they are raiding the Greek pension fund to make a Trokia/IMF payment with every nickel they can find under the couch, and the most recent that just knocked me off my rocker is the Greek government demanding war reparations from not only World War 2, but back to World War 1, a Century ago! This despite the fact that Germany made reparations decades ago to which Greece signed on and agreed and accepted payment. I can see why the latest poll out of Germany, for the first time this week has more Germans wanting the Greeks out of the Euro than in with a nearly10 percentage point jump over the previous week. I'm sure you caught the CNBC retort from the Greek Finance minister when he was asked if he is now a liability for Greece and hois well thought out, childish retort was "Are you a liability to your network?" before storming out of the interview. This is amateur hour to the point in which I suspect the government of the Bahamas would have been more credible and better functioning in Greek shoes.

Just as background and big picture perspective,  the Greek bailout was never about saving Greece, it was and is about saving French, especially German and other EU (and non-EU) banks which would sustain catostrophic losses if Greece were to default, this is why the Troika and Germany could not and would not allow anything more than a 4 month extension of the bailout the Greeks promised to walk away from. However when you can't collect taxes in your country, every industry is falling apart and no one in the world will export goods to you like say a new TV from Japan, I guess you get desperate and like people who are not doing well in trading, they jump desperately from one system to the next, never spending more than a month or so in any of them in search of what we call the "Holy Grail of investing" which doesn't exist. You can probably see the parallels and how all of this is rooted in inexperience and huge emotional swings.

I say this in all seriousness, watch the situation on the EU with Greece; this is bigger than the Lehman moment for the continent and I suspect it may very well lead to the 3rd World War on the continent and Greece will not be alone against the rest of the EU, by then either Russian or Chinese or both will have ports and boots on the ground. The EU is obviously thinking about this outcome as well as a new EU army has been proposed seeing NATO as being insufficient to guard the EU against perceived threats.

As for Leading Indicators, most are telling us the same thing we already forecast. First there's gas in the tank for the bounce this week and I believe it will run right up to the F_O_M_C meeting policy statement on Wednesday at 2 p.m. or thereabouts.

I know you've already seen these charts, but just to put things in perspective so nothing is given more or less weight than it deserves...

Index futures gas in the tank, distribution in to higher prices and Russell 2000 relative weakness...

 This 15 min chart of S&P futures (E-mini) or ES, shows a clear positive divegrence, it got a late start vs the Russell, but it put in the second part of a "W" base positive late last week seen to the far right of the chart. This is the gas in the tank for the base the SPY and QQQ have built, but until today, had yet to move out of and in to the light where they could be distributed in to higher prices.

 NQ or NASDAQ 100 futures have the same 15 min chart positive divegrence, remember after the price strength last Monday that we had forecast, both of these ended the week lower as we also forecast.

Again, this is the gas in the tank, the bounce I suspect runs up until the F_O_M_C.

 The 15 min TF or Russell 2000 futures chart (Same as above), looks sloppy,there's no clear divergence, it has weakened.

Starting from an earlier timeframe, but still a serious one and appropriate to look at the price action I'm talking about from last week in to this week, this is a 7 min chart of NQ/NDX futures. The chart shows the late last week positive divergence that formed the "W" base we had been proposing mid-week for a rotation among the averages.

 The very same timeframe (7 min) in Russell 2000 (TF) futures shows a very clear trend of distribution late last week, really from the moment R2K made higher prices out of its base.

Just to show there's confirmation and there's migration meaning the divergences are stronger (either have grown stronger last week or are growing stronger now and that includes both positive and negative divergences)...the 10 min charts...

 ES has a positive divegrence and is pretty much in line, even though we have already seen distribution on intraday timeframes, it needs to burn through all the gas in the tank.

TF/Russell 2000 futures on the same timeframe have burnt through all of the gas in the tank and are negative. You'll see a visual representation of this beyond just price percent changes from last week to this week and leaders/laggards among the averages.

As for the bigger picture that I have tried to keep in the mix, this is the 60 min, the strongest chart so far of all above, of ES/SPX futures, it is clearly leading negative as it followed the 3C divegrence lower in to stage 4 decline and wiped out the entire head fake move's gains. You can see to the far right a very small positive divegrence which is the 15 min divergence on the charts above, but it's wrapped in a much larger negative.

This is how we understand and use multiple timeframe analysis to our advantage in forecasting and trade set-ups. For instance, with such a strong negative 60 min chart, I want to trade it, but I don't want to trade it from the long side, not that it can't be done, it's just not with probabilities. I want to use any price strength to do what smart money has done, sell/short in to it, that's with probabilities and using multiple timeframe analysis to our benefit, it requires some patience and some intestinal fortitude as the entries will be against the prevailing price trend, but hopefully the fact that you knew what to expect nearly a week in advance gives you the confidence to take the analysis seriously as it proves itself.


As for Leading Indicators... You'll see what the tone of the market is both short term and long term (as well as intermediate). You'll see why I'm looking at the highest probability trade plan the way I am. You'll see why certain positions were closed like UVXY last week as I could have closed it on at least 4 other occasions and chose not to until now and why. There's a lot of information here and a lot of confirmation, like last week, the Cross Asset Correlation is a thing of Beauty, as if it were created by nature itself and the same applies for the charts above and below.

 Our custom SPX:RUT Indicator which told us ahead of time that the market would bounce as it is moving up most of last week while the SPX in green is moving sideways.

However, below when looking at today, there's no more confirmation and this is largely pointing out the problem of relative dislocations between the averages. Rotation among industry groups is HEALTHY in a normal market, however big differences among the averages like last week and most of today, are the exact opposite and are warning signs. 
 Today as you can see, there's NO confirmation of the trend so there's a leading signal telling us the SPX will move higher and then a signal saying that the move is not healthy and to beware.

 While not screaming, Pro sentiment was positive at the close Friday, pointing toward the continued strength in price, albeit a different set of averages, however intraday there's trepidation about following the market any higher in to risk on territory.

 HYG which I suspected would be used as a lever, is actually underperforming and giving a negative signal as a leading indicator.

If you have doubts, look at HYG through other timeframes, it works just as well intraday as a leading indicator as it does on a 5 min of 6 hour chart.


The 10 min chart shows HYG SUPPORTING the market in its stage 2 mark up mode from the Feb 2nd base, then at stage 3, HYG leads to the downside, how long is it before the SPX in green follows it lower?

Also locally, note the confirmation, even though HYG is in a leading negative position vs SPX, at each of the green hash marks and then note the lack of confirmation today at the yellow hash mark.

HY Credit or a risk on asset is not willing to chase risk, that's a problem and a leading indication of things to come. There's much more to it than simply risk on or off, Credit in the Corporate sector and its movement has a lot to do with equities , especially when they are using credit (issuing debt) to buy back shares to support stock prices as insiders slip out the back door at the best prices they can get.


 Look at HYG on a 6 hour chart, there was a big deterioration in 2013 or so, then in line confirming the market through 2013 and 2014 before deteriorating in to a PRIMARY Down trend. Just follow the red hash marks and you'll find lower highs and lower lows especially as the market loses upward momentum and turns more lateral in a wide, choppy range (increased volatility, lessened price gains).

The next logical move for HYG has been drawn in with a blue arrow to the right and a red hash mark, a lower low as the trend has been and already in a primary bear trend or bear market.

The SPX/market will follow credit.


 This is Spot VIX over nearly 2 weeks. I have inverted the SPX prices (green) so you can see the relative performance between VIX and SPX as the two normally move directly opposite each other. There's been a slight negative dislocation late last week at the light blue's (VIX) second high which failed to reach the previous one although the SPX made what appear to be similar highs on the chart, in actuality, similar lows.

 This is Spot VIX intraday, it is showing relative strength vs the inverted SPX prices. I suspect protection is being bought in VIX, but this wouldn't make sense from a hedge perspective, not for most of the averages that closed lower on the week. It does make sense from a F_O_M_C perspective and /or a leak perspective if the F_E_D is still willing to do that which I suspect they are despite this weekend's developments (which don't even include the early release by more than a day of minutes from an F_O_M_C meeting to 154 big banks and private equity firms by email more than a day ahead of schedule).

You may have seen over the weekend that a Texas Congressman has written the F_E_D and called the inquiry in to the leak of sensitive information to two sources including the Wall St. Journal (likely Hilsenrath) during 2012 ,   a "Criminal Investigation" for the first time ever . This was an investigation handled by the F_E_D's internal General Council which dropped the investigation at the behest of F_E_D members. Inquiries have been made by Congress oversight committees as to the progress of the investigation, but have not received a reply from Yellen or the F_E_D which was brought up by Democaratic Senator Elizibeth Warren during Yellen's recent semi-annual Humphrey Hawkins congressional testimony.

The latest letter was from Texas Republican, Hensarling in which he called the investigation now a "Criminal " investigation.

 This VXX /Short Term VIX Futures is another piece of the puzzle in which I decided to close the UVXY long at a +10% gain and look for a better entry as it will move opposite the market, thus pulling back for a better entry.

Note the divergence between VXX (blue) and SPX inverted prices (green). VXX underperformed suggesting near term market outperformance.

 Intraday however, VXX has been in line with the SPX, thus acting a a effective leading indicator last week.

The EUR/USD has been a big mover of the market and cross asset correlation, here's FXE (Euro ETF) vs the SPX (green), you can see today the Euro is lacking in confirming the SPX as of the capture.

 On a bigger picture basis of the February cycle, the Euro is leading the SPX lower, again, this confirms all multiple timeframe analysis signals we have.

As for the $USD in orange, I inverted its price vs the SPX so you can see the normal correlation. Once again, the $USD is suggesting much lower prices for the market in terms of our cycle, but in very near term (early this week) terms, it has been helpful via EUR/USD as seen earlier today in the A.M. Update.

Intraday, the $USD is failing to confirm the SPX upside, again, this is the short term tone of the market's move today which has been consistently negative, although expected.

 Even yields (30 year in red) vs the SPX have failed to support the move today and are negatively displaced pulling o the market to the downside.

Intraday the 10 year yields dropped, again putting downward pressure on the market at its base when yields "should be" leading or at least moving with the market if this were a healthy move.

 Commodities in brown have also been working as a leading indicator, you can see the overall trend as well as ome short term divergences and today's absolute refusal of commodities to confirm.

On a larger basis if you look at the Jan 29 to Feb 2nd base, you'll see commodities led the SPX, then at the stage 3 top commodities led again, but to the downside and now they are leading negative in a big way so bounce in the market, YES, a bounce that is more than just that? NO!


Market Update

As mentioned in today's earlier market update, there's still gas in the tank at least for the SPY and QQQ, but that doesn't mean it's not being perhaps, rapidly depleted. The first hint of higher prices in SPY and QQQ since last week have produced some of the strongest intraday negative divergences in the pair since at least a week or maybe more.

In addition as it's already evident in Russell 2000 price performance which is half the SPY and QQQ, there's additional weakening there as well, further supporting the notion of rotation in the averages (not good for the market unlike sectors), as we are already seeing in price performance today.

A look at intraday charts...

 This may look like Russell 2000 futures intraday, but in fact it's ES/SPX futures.

This is NASDAQ futures intraday, both look substantially worse for the wear since the earlier market update.

 And TF intraday.

This is also present in the SPY charts unlike areas last week where there was almost no movement on these intraday charts which as predicted then, looking back in reflection it would be easy to see why...the SPY and QQQ made no price advances outside of their bases for the week, thus there was nothing to sell in to, thus no divergences, just waiting.

 SPY 1 min

The divegrence has migrated all the way to the 5 min chart now from the 3 min chart previously which is a big jump between a 3 and 5 min chart, although it sounds very small, it is significant.

While the larger trend for the QQQ on a 10 min chart like this is clearly negative and stage 4 decline, you can see the "gas in the tank" to the far right for a bounce, however the larger negative is not over, the smaller positive is just inside that larger negative trend which in multiple timeframe analysis would equate to any bounce in the QQQ would fail and resume the larger preceding and current leading negative divergent trend, DOWN.

 However despite "gas in the tank", the QQQ is also seeing further chart deterioration as the 3 min intraday leads negative.

The IWM intraday is worse, price performance is worse and it has rotated out on a relative performance basis.

The former "gas in the tank" is now reversing and this IWM divegrence (10 min) should continue to deteriorate and return to the larger overall negative trend.

As for levers, there's a little weakness in TLT along the lines of a gap fill that could help the market maintain and...
 HYG, although down on the day, has a small intraday positive divergence that "could" help if it can lift HYG out of the red.

As for VXX, I'm glad to have closed the UVXY long on Friday and preserve the gains, but as I said, I'll be looking for a new entry long in short term VIX futures and they are acting better than you might expect given the percentage gains in SPY/QQQ.

 VXX intraday and the reason for closing UVXY Friday evident, but an overall positive reaction to the pullback in VXX/UVXY so far, confirming the negative reaction in the averages and Index futures.

While VXX 3 min is not yet leading positive, more in line except for Friday's divegrence which was the reason (or one) for closing UVXY, remember what sits at the 15 min+ charts for VXX, UVXY and XIV...

VXX 15 min leading positive like the larger leading negative divergences in the averages.

While there are other assets to look at like EUR/USD...
Which is clearly playing a role in the road block in price gains since early momentum this morning...

My impression is there's a bit of a hurry to sell in to strength quickly , the only reason I can think of is the same I suspected last week and why I suspected we'd bounce right up to the event, Wednesday's F_O_M_C policy statement and whether or not "Patient" is among the words in the statement which as of now, is widely expected not to be.


USO / Crude Oil Update

This is Friday's USO Update , it contains charts and excerpts from updates earlier in the week such as Tuesday and what we anticipated oil would do next, thus far it has done exactly what was anticipated since the probability of a large primary trend base started to over take the probabilities of a shorter term counter trend bounce that would leave the primary downtrend intact after the bounce.

There have been many theories as to why the price of oil declined from imposing a kind of sanction on Russia, an oil exporting nation for their actions in Ukraine and Crimea to that act being driven by the US and suddenly turned on the US by OPEC/Saudi Arabia to crush the ?US Shale Oil Industry who can't produce a barrel of oil for what the current market price is, thereby wiping out the US shale producers and leaving OPEC and some other large non-OPEC producers in complete control of supply and demand once again. An advisor for the Saudi minister of petroleum recently went on record about reasons given to the Bank of England's Mark Carney when he asked 1) What caused the price decline and 2) where oil prices were going. The answer about what caused the price decline seems to be, "I
t was all perception and conspiracy theory, herd mentality that secret actions were being taken to hurt one country or crush another's oil producers and he claimed it was all non-sense conspiracy theory that had actual results as we know all too well, Perception drives prices, rarely is it fundamentals and as to question #2) While the general answer was "If I knew I'd be in Ls Vegas", the broader sentiment was hopeful for the future of oil prices stabilizing and rebounding based on real supply and demand fundamentals. To me, all of this makes about as much sense as the F_E_D tightening policy right now (as I have said, I don't think the F_E_D should be sitting at 0% rates for the last 5-6 years), but on a macro data basis, if one looks at things objectively, it's hard to justify a tightening cycle based on the horrible macro data since Q4 2014 through present. Yes the F_E_D's current policy is that of EMERGENCY action and no we are not in an emergency situation, therefore some balance seems reasonable, but the way things are going, it doesn't make a lot of rational sense to tighten right now as everything in the US and globally has weakened and the F_E_D inflation forecasts have been dead wrong for 2+ years now.

That being said, it seems they are and have been on a course of tightening, they have tightened just by ending QE and it seems they will again. The point is, it seems the F_E_D is much more worried about something that's not out in the main stream press, unless the macro data coming in as bad as it has been is the answer hiding in plain view. Meaning the F_E_D's policy is so wound up, there's no room to deal with any new recessions or economic shocks, therefore they maybe need to create some room or they simply see or are worried about something that we are not privy to. In the same way, I don't know what really caused oil to drop as it did, I only know that SOMEONE knew in advance and someone seems to know now in advance.

 This is the daily chart of USO and the price decline. If the current lateral price pattern we can observe through most of 2015 were a consolidation phase, we'd expect to see lower than average volume, instead we see much higher than average volume which as you know, is most often associated with a reversal.

For instance, just like our candlestick (reversal) concept and higher volume making those signals more probable by 300-400%, the same is true of oil, you just have to look on a larger timeframe like monthly...
The last time oil saw a major spike in volume it wasn't on a decline or a consolidation , it was at a bottom in 2009 similar to the same volume pattern playing out now, although without the same history (yet) seen in 2009.

As for conspiracy theories, I don't know and beyond simple curiosity, I don't care. The market told us back then that something was not right with oil, someone knew something whether it was part of one of the conspiracy theories or something else altogether than we haven't heard or.
 The 2 hour 3C chart has one of the worst divergences in oil I may have ever seen including the 2008 top and it's at an area in which there was a top price pattern (H&S top), someone knew something and was getting out of the way, clearing out their longs, establishing shorts so this wasn't some innocent misunderstanding of perception.

In similar manner, the current signal is the polar opposite. While the pundits either call for lower prices and celebrate as oil moves lower or they call for a bottom and are heart broken as they see oil move lower, we've had a different perspective, one that we just saw on an intraday basis in the SPY and QQQ last week leading to today's price action. The concept is EXACTLY the same, the timeframe is different, a "W" bottom. The 3C chart above suggests that someone with deep pockets believes or is making sure this is a bottom and I know of investors that have large oil tankers sitting off the coast just holding oil and waiting for prices to rebound so they can start selling them so they obviously believe for their own reasons.


 This is a close up of the 2 hour chart. Since we had called for a break below a descending triangle last week and prices have moved that direction, this chart hasn't moved, that's simply because to move a chart like this you need to have a huge amount of accumulation or distribution. If our theory about a wider base or double bottom was correct/is correct, then we wouldn't expect to see accumulation until we reached the area of the first low which we just hit today, therefore accumulation if anything, would be just starting and certainly wouldn't be reflected on this long of a chart. The other side of the coin is the decline we have forecasted and seen, is also not creating large distribution. If you are a large firm or "Deep pockets", you don't want to give up the shares you accumulated on the cheap if you are only half way through your accumulation. Unlike us, they can't place a full order for a full position size at once without sending price way against their position and having every predatory algo and every human trader with half a brain front running them, it's done in pieces which is why we call it a "Process", not an event like our smaller orders would be considered which have no effect on the market.

 This 30 min chart is going to move before the 2 hour chart, but the point is the same, it doesn't require as much accumulation or distribution to move, but either way, it hasn't moved suggesting this is a larger base being put together, but we are just now reaching the accumulation area and it hasn't begun in earnest yet to the point in which it would move a chart this large which is still quite a lot of accumulation/distribution to move. By the same token, the downside move we forecast to make a "W" base hasn't caused any noticeable distribution which would appear here a lot earlier than a 2 hour chart. IT seems our theory is right, at least as of now.

If you note the trendline, I also forecasted that as with almost all double bottoms (like a "W" except larger) we'd see a head fake move BELOW support, this is where I'd want to buy USO or add to it , but this is likely to be a process as well in line with the size of the base, not a 1-day event.

On a 15 min chart we can see the signals that moved prices from accumulation at the former lows to an area of resistance at the red trendline with a negative 3C divergence, part of the reason we expected a move lower and this to be part of a larger base so both sides of the "Oil is going lower and oil is basing and going higher" are correct and both are wrong, they just can't see the picture we can see which is, "Oil prices had to move lower to form a larger base to support a move higher".


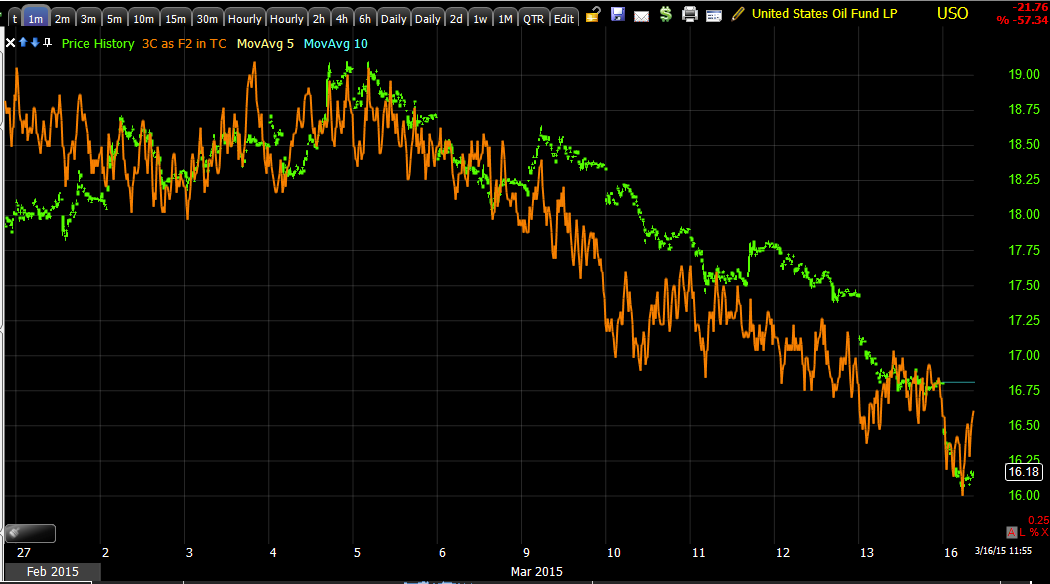
So far intraday, price is in line with the move down we forecasted below the descending triangle, meaning the accumulation cycle of the second area of the base hasn't started to any large degree yet and CL /  Crude futures confirm the same.

The 1 min CL chart shows a negative intraday divegrence to send oil lower to the area we forecasted.

How can we play it from here? Well first we have to confirm our theory is correct, but thus far everything I see says it likely is and we need to get signals strong enough that they move the 15 min , 30 min and maybe even the 2 hour charts. This is not going to happen in a day, probably not in a week, it is a process and you can probably gain some insight as to how long it will take by looking at how long the first area took and imagine the symmetry of the price pattern, they tend to have symmetry. Don't forget the head fake move. In order to steal shares of the long who believe oil is headed higher, they'll have to scare them out of their shares which means creating a head fake move lower that is scary enough to cause the emotional response to activate and sell the shares on the cheap,  this is where I'd like to be a a buyer, so you can use your own emotional response to price as a barometer, if it scares you and makes you doubt any base is possible, it's probably the right area to buy, but these responses are extreme to knock out the hardest core longs.

As for where oil is going, I can't say beyond making a price pattern based guess, but with a primary trend reversal, I think that guess would be on the low side. Who knows what is causing smart money to accumulate, perhaps they know something about future opec plans which may be to say, "Hey, there's so much oil in reserve, we can cut production down to a trickle because if we don't, they can just sit on those reserves of cheap oil for a long time and no longer need to buy from us" as the reservoirs are nearly full in the US alone.

Thus, this may have NOTHING to do with global growth and demand and everything to do with production quotas being severely cut. Whatever is going on, there's a reason for it and someone knows why, we're just trying to follow that someone and we'll understand later , hopefully after we are sitting on a large profit why exactly price reversed higher as I anticipate. Again, just a point of interest by that time.


Market Update, All is not what it seems

Looking at price percentage gains themselves this morning, it looks like our "Week Ahead" forecast is right on, early strength,  but beyond that, rotation out of the Russell 2000 and in to the SPY/QQQ; this is evident from price percentage gains themselves with the IWM under-performing on a relative basis.

However under the covers, things are more interesting than I expected them to be this early, except maybe the IWM.

Lets start with the SPY,

SPY intraday struggling to confirm...

SPY 2 min also showing the same, in fact all the way out to 3 min. This is either an arbitrage reaction intraday to the slight weakness below in EUR/USD or it's selling of price strength, this is the first time since last Monday there has been any price strength available to sell in to in SPY.

The Q's are showing the same thing...
QQQ intraday failing to confirm. Remember what these look like as you'll see the IWM below.

While these are intraday and not really any threat to the forecasted early strength as there's a larger divergence powering this move or gas in the tank, it is indicative of how higher prices are being treated, or possibly the correlation, but I suspected the former over the later.

The intraday NYSE TICK reveals breadth is nowhere as strong as you'd expect for the price percentage gains of 1%.
While not horrible on the downside of TICK at -500, the upside has only made a couple of brief forays into the +1000 zone which is the low end of extreme, in other words, not very impressive.

Last week there was a high, high degree of cross asset correlation and it's here this week too.

The recent slowing down of momentum can obviously be attributed to one of those assets, the EUR/USD...
 intraday 1 min EUR/USD with a negative divegrence and the correlation with Index futures (ES)...

You can see EUR/USD vs ES (purple) has had some effect on recent momentum and 3C intraday signals.

HYG, the ramping lever which does have some gas in the tank and could lend some support, thus far has not.
While the area at the white arrow may provide some intraday support, thus far HYG is red on the day. I would expect HYG to diverge from the averages first as it has done, but I wouldn't have expected it so early.

As for rotation, well you can probably see the IWM or Russell 2000 futures are struggling beyond the price divergence with SPX/NDX...

 This is the intraday TF/R2K futures 3C chart, compare to the ES/SPX futures below...

Looks a lot weaker than ES doesn't it, this is likely the rotation taking place.

And the IWM intraday as I mentioned to remember what the other averages look like intraday...
IWM 1 min intraday looks much worse than just non-confirmation and some slight distribution in SPY and QQQ, this looks like it could turn down as I have suspected and rotate out, it allowed higher prices to be old in to last week, it may be the SPY and QQQ's turn with IWM actually diverging beyond relative performance and actually in to the red. If that's the case, then there are some positions I'd like to get set up early in IWM.

I'm looking at more cross asset correlation as that was where we found the most revealing signals last week, really toward the end of the week, but it looks to be carrying through to this week as well. Take a look around at other assets, even loosely correlated or seemingly connected ones, I think you might be surprised how much information they are willing to share if you just look.


A.M. Update

Good Morning, I hope you had a fantastic weekend and a great week ahead, MAKE IT SO!

As to mine, check the bottom of the post and there's a mystery question...

As for futures, they're right in line with the first part of the Week Ahead forecast from Friday, which is early week strength including right up to the F_)_M_C announcement on Wednesday at 2 p.m. being the SPY and QQQ had never left their bases last week and gave the market nothing to sell in to, in fact they were right in line with last week's forecast of early strength (Monday) and continuing weakness the rest of the week which they all saw except the Russell 2000 which did see distribution as it DID give the market something to sell in to. I also expect relative performance rotation out of the IWM/Russell 2000 and in to the SPY/QQQ in the first part of the week.

Futures are said to have rebounded overnight on EUR/USD strength or support after the $1.04 handle was broken and rallied off it, but I suspect this was all in the cards well in to last week and this is just more 30 second soundbite justification so people can understand why the market is doing what it is doing which is far from understanding what the market is likely to do before hand, but it gives people a sense that they have some control over the market in understanding what it is doing rather than what it will do.
EUR/USD overnight after having broken the $1.05 support again (same as last week) and found support to bounce above $1.05, this is the reason being given for this morning's price strength even though we expected it as far back as Tuesday of last week and reiterated it on Friday's Week Ahead forecast.

Of course the main attraction this week is the F_O_M_C meeting in which it is widely expected the phrase or word, "Patient" with regard to rate hikes will be removed and every headline scanning algo has already been programmed to look for the word, "Patient".

As for the market and picking up where we left off, you already saw these charts last week, but it's worth a quick overview...

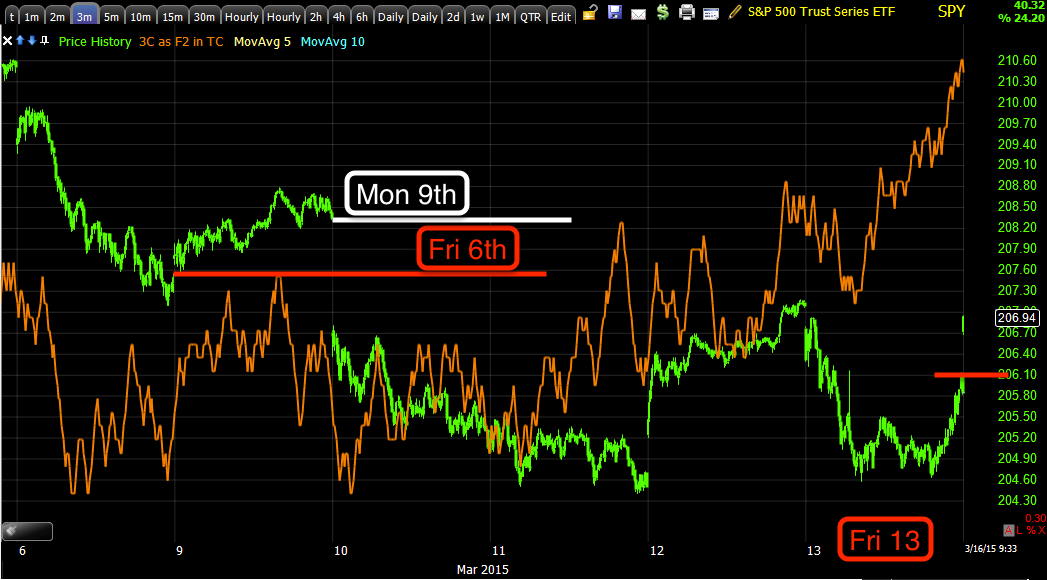
 Friday the 6th's close and early strength last week on Monday the 9th as forecasted with continuing weakness (price) in to the rest of the week, Friday the 13th closes lower on the week.

The same chart without all of the scribble and a clear "W" base that SPY never left, never gave the market a chance to sell in to any strength so this morning's open isn't a surprise in the least and picking up where it left off essentially.

As for IWM rotation, unlike the rest of the averages for the most part...

It not only saw price strength Monday, but formed it's base starting Tuesday when we started closing down QQQ and AAPL puts and expecting a bounce and Friday when UVXY long was closed preserving a +10% gain to re-enter at better levels like the QQQ/AAPL puts.

The 10 min chart shows the base and distribution in to higher prices which is why I suspect rotation out of the IWM and in to the SPY/QQQ/DOW.

The Russell 2000 futures show the process more clearly...
TF 7 min "W" base last week, bounce and distribution in to higher prices, something the SPY and QQQ couldn't achieve last week. Note it's the same kind of "W" shaped base, pretty common in these waters.

In fact on an intraday 1 min basis since the new week, last week's forecast which was put out before Friday as I suspected it would look like Friday's forecast a bit earlier is seeing confirmation already in the intraday charts.
 ES 1 min for this week's start to futures is in line with only a very small 1 min negative right now, not quite enough to do any significant damage.

NASDAQ 100 futures 1 min look the same for the new week's futures trade, but...

TF/Russell 2000 looks quite different, so this will be one of the first places I'll be looking for opportunities if I feel that it's not just relative weakness, but an actual top for the IWM, then puts would make sense or inverse ETF's or simply IWM short.


Once again, see if you can spot the odd chart out and why I suspect rotation which is not generally good among the averages (it's great among industry groups) looks so plausible...

Spot the odd chart out (10 min Index futures)

 ES 10 min

NQ 10 min

TF 10 min

Pretty easy huh?

As for Gold and oil, well they are right where we expected them to be and getting more interesting by the day, I'll be covering these today...
 In January we called for a GLD pullback and a probable long entry after it completed. Does it not look like a selling/capitulation event on the break below support a little over a week ago and a base building bit of price action since?

As for USO, we called for a larger base which meant price would have to move toward the January lows, even a specific call for a break below the descending triangle and what do we have, oil right where we expected it, now to confirm accumulation of lower prices.

As for the event of the week, I don't know how the F_E_D will defend raising rates or even removing "Patient" as even this morning's Manufacturing output fell for a 3rd consecutive month, a big miss and back to Lehman levels.

Thus if the F_E_D does hike rates, in this environment, they are doing it for a reason they have not clearly stated, something they are more worried about than what a rate hike will do to already very weak macro economic data not just in the US, but globally. I wonder what could be so scary to them?

In any case, hopefully we'll start to get more clarity as more pieces of the puzzle are revealed.

As for my weekend, I went to work with Andrea and have never seen such a massive gathering of humans...

 THis is Calle Ocho (with the Miami skyline in the background) , a traditional Miami latin street festival in March which I believe translates in to SW 8th Street, which is where it has been held for over 30 years.

Hint, the line of people you can probably make out upon closer inspection stretches way past the bottom side of the picture and ends where the red arrow is at the top of the picture. As far as how many people...? All I know is they hold the world record for longest congo line of some 120,000 people!

And this is our bird's eye view.

Lets get to work!