Monday, May 11, 2015

Daily Wrap

Today was interesting for a myriad of details, but not too far removed from the The Week Ahead forecast. Early weakness was not as weak as I expected, but then again I don't believe it is done.

The VXX Call position opened Friday after Taking Both VIX Puts off the Table and opening Trade Idea-EXCEPTIONALLY SPECULATIVE...VXX Short Term Calls, worked well and was well timed. The VIX call trade which was meant to be a very short term trade, essentially taking advantage of any weakness early in the week, actually ended up (with the May 22nd expiration rather than the intended May 15th expiration) closing at a gain of +.22% for the day. That is what the trade was essentially meant for, although I decided to leave it open as I believe we have more downside. See today's VXX / VIX Futures Update.

Interestingly the TLT long (call options or because I could not get calls, I used TBT short to create a 2x leveraged long TLT position) position from Thursday, Trade Idea: Long Bonds / TLT was put on at half size as a counter trend trade/swing+ trade as posted in Bond Rally / Swing as well as Friday's The Treasury Counter Trend Trade which said the same thing as both posts on Thursday...

"This tells us that a near term pullback is likely even though the position entered yesterday went green today. I left room specifically to add based on expectations we'd see a pullback as the chart above indicates."

So weakness in the market early in the week, VXX bouncing and TLT / Treasuries coming down to build out a wider base were all expected today and for the most part, were all exactly on target except I expect a bit more weakness from the market which we'll get in to below.

There's also the question of oil/USO which is getting to be interesting. Who knows what happens with Greece tomorrow.

 Despite what we saw as of last week and forecast, it "seemed" like stocks were holding up early on what "seemed" to be considered a rotational move from bonds to stocks or some trepidation waiting to see if that theme caught a toehold. As you can see small caps (yellow) and transports (salmon) were the best performers on the day, still the Russell 2000 only closed up +0.07% on the day. Everything else was down about half a percent.

Above we have 30 year yields in red intraday versus the SPX in green and just as 30 year yields which move opposite treasuries, broke 3% the market hit another leg down. So much for any rotation perceived or otherwise.

This is TLT in red as the bond market closes at 3 PM. Note how the SPX tries to bounce after the bond market closed, but new highs in yields (via futures) killed that move.

 Remember our treasury trade, rather countertrend trade. I only opened a half position as I suspected treasuries would come down to form a larger base before moving higher.

Shorts in treasuries are near their extreme range so there is a lot of fuel for a short squeeze and the perfect place for it.

 There's little doubt in my mind that treasuries continue lower on a primary trend basis as the 60 minute chart shows with 3C downside confirmation.

 However near-term, this 10 minute chart moves from in-line to a positive divergence and a wider base running additional stops today. This is along the lines of what was expected on Thursday and Friday, thus the half-size position which can be filled out.

 The five minute chart shows more detail and a stronger looking divergence in TLT (20+ year treasuries).

 And the two minute chart shows a change in trend as well.

Here's a closer look with a negative divergence on Friday as was suspected. I would wait until we have better short term chart confirmation of accumulation before entering the second half of TLT long/ calls. However, There was already evidence of that process beginning and across the entire yield curve.

 30 year treasury futures on a one minute chart intraday with a positive divergence as prices come down below Thursday's low, exactly what we would want to see when we suspect a base is being built.

This even migrated to the five minutes chart.

The five and 10 year treasury futures are also showing positive divergences intraday. I suspect we're going to see a nice countertrend short squeeze but I do not see this as a trend reversal.

As for the averages and my belief we will see more weakness…
 SPY 2 min leading negative

SPY 3 min leading negative

IWM 2 min leading negative

IWM 3 min leading negative, However as I've already made clear, I suspect we may see a bounce attempt but we will only know what the probabilities are once we see price come down some more and determine whether or not it is being accumulated short-term.

 The QQQ 10 minute chart would exemplify this bounce, with Price coming down forming a wider base than simply the "V" from last week.

Futures have something say as well...
 The five minute ES chart suggesting more downside near-term

The five minute TF chart suggesting the same.

Bounce or not it doesn't change the big picture...
 Four hour ES

Four hour TF/ Russell 2000 futures.

We may see a little bit of strength early in the morning, recall my comments regarding NFLX trade set up. This is based on some one minute charts.

SPY 1 min with a very minor positive divergence. The two and three minute charts above are the highest probability near-term, but this may be the start of accumulation into a move lower as I just mentioned above in determining probabilities of a market bounce or attempt.

As for oil...Timing wise this seems to make sense. The wall street journal reports that OPEC could consider production quotas at the June meeting. If oil/ USO make the move lower as I suspect and gather a head of steam, the June OPEC meeting could be the catalyst for USO to break out to stage 2.

Right now only Kuwait and Qatar can meet their budget at $76 a barrel oil according to the IMF, that means OPEC members can't afford prices this low much longer.

The Dominant price volume relationship today was in all of the averages except for the Russell 2000 and it was closed down / volume down, which I have nicknamed, "carry-on" as in keep doing what you're doing, meaning the market is likely to move down tomorrow as it did today as there are no short-term internal imbalances.

I'll check on the futures later to see if anything interesting is developing but as of now I don't have anything to add to what has already been published late last week and today. If I do see something in futures tonight, I will post it.

I think we'll have some nice opportunities over the next few days for both short-term leveraged trades and longer-term trending trade entries as well as seeing some current positions post gains like VXX.

Have a great night

VXX / VIX Futures Update

From a quick look at VIX futures and the derivative ETFs,: VXX, UVXY and XIV, there's a chance that the NFLX trade set up may come around. I think there's an even better chance that VXX calls work well, but remember that these were entered Friday as a speculative position for a quick trade so if I found myself with a +30% gain for a single day, I'd likely take it and wait for the next set up, especially for strikes at the end of this week.

The intraday TICK chart tells me it's not very likely we see a lot more in the way of VXX Call gains in to the close.

However as to the charts themselves...

*Remember VIX futures are actual futures, not spot VIX. VXX is short term VIX Futures. UVXY is the 2x leveraged ETF of VXX and XIV is the inverse of VXX which moves with the market rather than opposite of it as VIX does so I include as many as I can for multiple timeframe analysis and multiple asset confirmation as the volume for each is different and therefore can serve as a confirming (or not) signal.

 VXX 1 min with a leading positive divergence since last Friday, another part of the near term clues for this week's early forecast. This continues to lead positive. Note at the last pivot down on the 6th, there's no distribution, not even on this very fast/sensitive 1 min chart suggesting a large VIX/VXX position is under accumulation.

 This is the inverse of VXX, XIV and it shows a mirror opposite chart with a leading negative divergence not confirming last week's gap up, thus we have confirmation.

This is the 3 min UVXY (2x leveraged long VXX) with another leading positive signal.Like VXX, no distribution at the last pivot high on the 6th.

XIV (the inverse) 5 min with a leading negative signal.

So far we have numerous assets confirming in multiple timeframes. Note the very sharp "V" base which is what I expect to fail here (the gap off it).


 And the longer term or accrued big picture is this VXX 15 min chart, as I said above when we saw no distribution on even the smallest/shortest 1 min charts (minor signals), it looks like someone has been accumulating quite a large position and this 15 min chart is the accrued evidence of that.

These are actual VIX futures...
 1 min intraday has been in line with all the upside moves today with a minor negative divergence now, which fits with the TICK chart at the top.

The 5 min VIX futures leading positive , also a minor divergence intraday that fits with the TICK chart's change above.


 15 min VIX chart leading positive...

And 30 min also leading positive.

This tells me the market is still very likely to see that early week weakness mentioned in the Week Ahead, I don't think we have fulfilled that move.


NFLX Update

Today's move looks like a parabolic move and I never trust parabolic moves whether up or down as they tend to end the same way they started, just the opposite direction.

We do have some Put and equity short positions in NFLX and I'd be open to a put position on today's move if I though the set-up was strong and the risk low. I believe the probabilities are with NFLX pulling back down, but I don't quite yet believe this is a high probability/low risk trade set up.

Hopefully it gives us a better set of signals in to some better prices than what they currently are.

*This post is only dealing with the very near term, the longer term NFLX analysis has been posted numerous times recently and nothing has changed in it.
 On a 15 min chart you can see the parabolic nature of the move off a rounding base. We have momentum falling off at the red arrow (Shooting Star-like" candle.

I'd prefer to see some higher volume on a candle like that.

The 10 min chart shows no support or 3C confirmation for the move so I suspect it fails rather soon, hopefully before it does, it offers a higher probability / lower risk entry.

 The 5 min chart is not only NOT confirming the price move, but is leading negative divergent.

 The 1 min intraday chart has put in a turn to the downside after earlier confirmation, I'd like to see this a bit deeper of a divergence with price a bit higher.

And there's migration or strengthening of this negative divergence. Still for a high probability/low risk trade, I'd like to see some better reversal signals at higher prices. This isn't a matter of probabilities, it's a matter of a High probability/Low risk and well timed entrance; there is a difference.

The Greek Situation

If you watch the NYSE TICK chart you can virtually see events unfold in the EU regarding Greece.

This is the NYSE TICK (1 min) chart for today. Firdst Greece reinstated the jobs of thousands of public civil servants, the 20 month "Cleaners" protest. These cleaners of Greek government buildings were fired under the Austerity demands of the Troika almost 2 years ago and have held a constant protest since, today the Greek government rehired them as the final EuroGroup meeting with Greece and the Troika or EU Finance Ministers took place which no one held out any hope for a resolution and disbursement of $7bn to Greece before tomorrow's massive approx. $750 mn Euro IMF payment due.

The rehiring of the public cleaners did not go over well with the Troika as released in in a statement today,

"This is clearly against the spirit of reform agreements with the troika of the IMF, European Central Bank (ECB) and European Commission."


Then Russia asked Greece to join BRICS development bank...


"Russian Deputy Finance Minister Sergei Storchak spoke with Greek PM Alexis Tsipras today, proposed that Greece become 6th member of New Development Bank set up by Brazil, Russia, India, China, South Africa, a Greek govt official says in e-mail to reporters."

This "seems" to be a pivot toward Russia which will come with a pound of flesh should Russia give Greece aid. I'd guess namely a Russian Naval Port smack dab in the middle of the Mediterranean, which Europe and NATO (including the US) would not be too fond of.

Now as TICK starts to break the small uptrend channel that occurred about the same time as the Russian offer, word is out confirming what everyone already knew going in to the EuroGroup meeting today. It is now official...

The EuroGroup meeting regarding Greece has been concluded with no further funds disbursement, but a lot of "goodwill statements". The bottom line is the same "Comprehensive list of reforms that was due (I can't count how many months ago, over a weekend) is still no closer to being done. In other words, when Greece achieved absolutely nothing from negotiations except to rename the "Troika", "The Institutions" there has been absolutely no progress toward the disbursement of the next $7bn Euro tranche and tomorrow's $750 mn IMF payment is looming...

I want to believe that Greece has a Plan "B". How could they go in to negotiations, push as they did with no leverage and without a plan "B"? Sadly these political amateurs seem to have absolutely no plan "B". 

USO/Oil Update

Speaking of multiple trend analysis, USO/Oil is one that has several interesting trades. For some time, most of 2015 we have been making the case for USO/Oil in a bottoming process to reverse the former primary downtrend to an uptrend. So very long term on a primary trend basis, I actually like USO a lot, but I don't feel we are quite done with the base area and ready for that trade.

Locally USO had been bumping in to resistance at the top of the base area. About a week or so ago I suggested that this stand-off with resistance may end with a head fake move above resistance in a "seeming" breakout, which creates strong downside momentum on failed moves, it appears that is what has happened so I'm fully expecting USO to pullback, how significantly though I'm not quite sure. It may be a pullback as initially anticipated all the way to the bottom of the base around $16 or it may be just enough for USO to gather a head of steam on a pullback (accumulate) to take a real shot at a stage 2 breakout to the "rally" portion of the primary trend.

Here's what has happened recently in USO as I suspect a near term (as in a day or so) bounce off support/resistance of the base, that "loitering" in the area and likely has to do with $USDX expectations and some very near term weakness, but I fully expect a strong pullback to follow so I suppose we could call any short term bounce the minor trend, the pullback , the swing trend and the eventual breakout to stage 2 the primary trend.

 This is the base or the second half of it on a daily chart of USO. Note before the last run that broke above the base's resistance in yellow where we saw churning on candlesticks with long upper wicks (higher prices being rejected) as well as heavy volume, the 30+% move started with a head fake below support mid-March. In similar manner, I consider this same move above resistance as the same sort of head fake, just to move in the opposite direction. This is one of the characteristics of head fake moves, they tend to move fast in the opposite direction once they occur with a lot of momentum and they tend to be excellent price-based timing signals as they occur just before a trend reversal on the respective timeframe they are observed on.

At the white arrow Friday just after Thursday's penetration of support, we have a bullish candle/reversal suggesting an upside reversal although it carries no price target. I consider this to be the weakest candlestick signal as volume did not increase on the day the ha,mer showed up, although it did show up right at the trendline suggesting very near term support along the lines of the minor bounce I'm talking about above.

 Our custom DeMark inspired Buy/Sell indicator shows 2 sell areas, the first at resistance and the second on the break above resistance which is much larger, but note the buy signal before that right at the head fake/stop run below support (green signal and yellow arrows for a head fake move or false break down).

 The longer term 60 min chart which shows some of the heaviest underlying trade has been the one the entire time, long before we broke above resistance, that suggested this move could not hold without a pullback and some work being done to repair this chart which would occur on a pullback that shows accumulation (constructive pullback). That would be where I'd be considering the long term trend/primary long position.

 This 15 min chart also shows the head fake/stop run below the base's support at the white accumulation area and yellow head fake/stop run. The shares stopped out are easily accumulated in size with no one wondering, "Who's on the other side of the trade?", an easy way for institutional money to accumulate large positions without attracting attention.

Again, at the break above the base's resistance, we see a strong leading negative 15 min chart suggesting distribution just as the daily churning candles suggest.

 However on the less influential, but nearer term 3 min chart we see not only the distribution above the base's resistance area in red, but a small (3 min) positive divergence right at the hammer Friday.

This is the intraday 1 min chart.

So I suspect a small minor term trend that sees small bounce,  this may be an excellent set up for put positions or swing USO short positions. Typically the reversal to the downside on a failed move/head fake (bull trap) is a very fast one (consider the Channel Busters and how fast they move to the opposite side of the channel).

Otherwise, I don't see any significant changes in our USO/Oil forecast.

As mentioned, I believe this has to do with the $USD and some signals there as oil is a dollar denominated asset and typically will move opposite the $USD.

 On a short term $USDX 5 min chart there's a very minor negative divergence to the far right suggesting a minor pullback which actually makes sense as I am expecting a counter trend bounce in the $USD's primary trend, this would help build the base area for that counter trend bounce.

The 30 min $USDX chart which is substantially stronger than the 5 min above, shows the positive divergence that has been the source of my belief the $USDX will see its 2 or 3rd counter trend bounce since we called for a primary trend lower breaking to lower lows as has happened.

Just as the 30 min chart is much stronger than the 5 min chart, this 4 hour chart is much stronger than the 30 min chart. These do not negate the signals of other charts, but show multiple trends singing up such as a counter trend bounce. Our April 2nd $USDX forecast called for a bounce  which occurred at the green arrow which was to be followed by a much larger move to the downside at the red arrows since, making lower lows in the primary trend as well as a lower high at the green arrow bounce.

The yellow arrows represent the counter trend bounces. I'm not sure whether to call the last one a true CT bounce or just part of this 3rd one being worked on now. The 5 min $USDX chart shows a small pullback which would give this CT bounce base a wider foot print and likely be a stronger CT bounce than the previous ones, but ultimately it should fail and make a lower low.

If you invert the $USDX expectations as oil and the $USDX trade opposite, you'll see that they confirm each other with regard to a very short term minor move, a swing counter trend $USDX bounce and larger $USO pullback and the primary trend lower in the $USD would be in line with our expectation of a primary trend higher in USO/Oil.

If I see the bounce which I have alerts set up for in oil, I'll take a look and see if there's a decent looking entry for the swing trade lower.


Quick Market Update

The "weakness" I am looking for since late last week's forecast for early this week, still hasn't materialized to any great degree, but all of the signals are still pointing that way and are intensifying so I fully expect we will see that weakness. It seems we saw some early stop run activity this morning. The kind of weakness I'm looking for should at least fill the recent gap (up) in the major averages if not some...

Here's a quick update of near term intraday activity....
NYSE TICK Index activity has been trending down all morning, but it is starting to reach downside extreme levels -1250, etc. so intraday breadth (selling) is getting stronger.

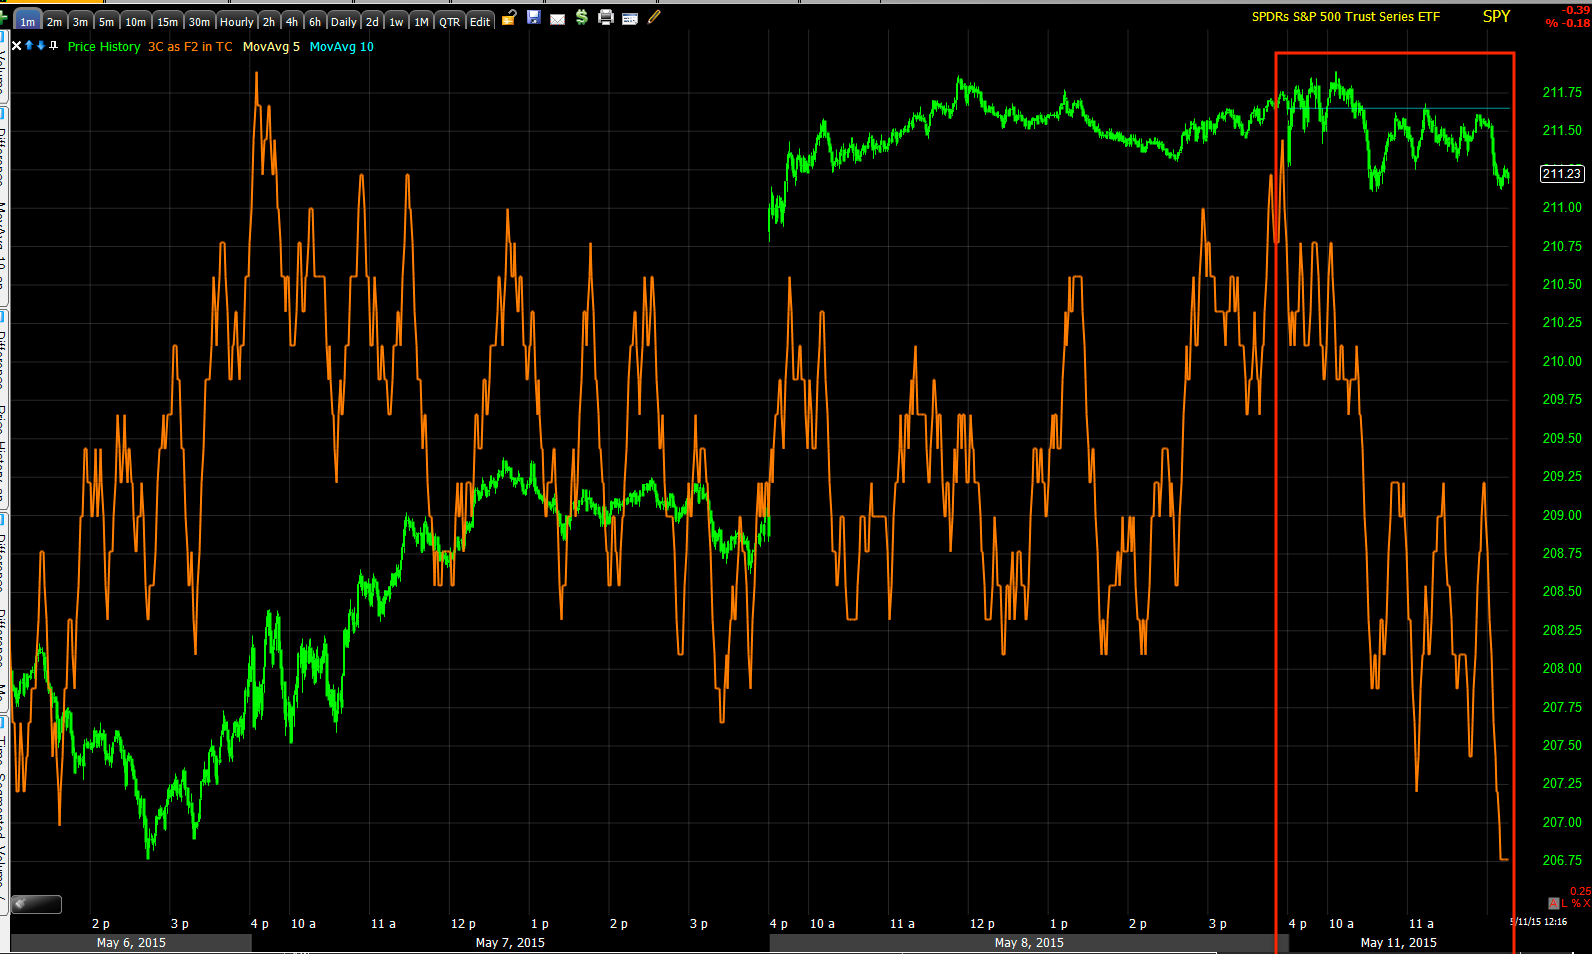
 Again this SPY 3C chart is one of several charts that told me late last week that probabilities were for weakness early this week in the averages. Note there has been no improvement (2 min).

 The intraday SPY 1 min chart has seen significant deterioration today (in the red box) and is leading negative so I expect downside momentum to pick up shortly.

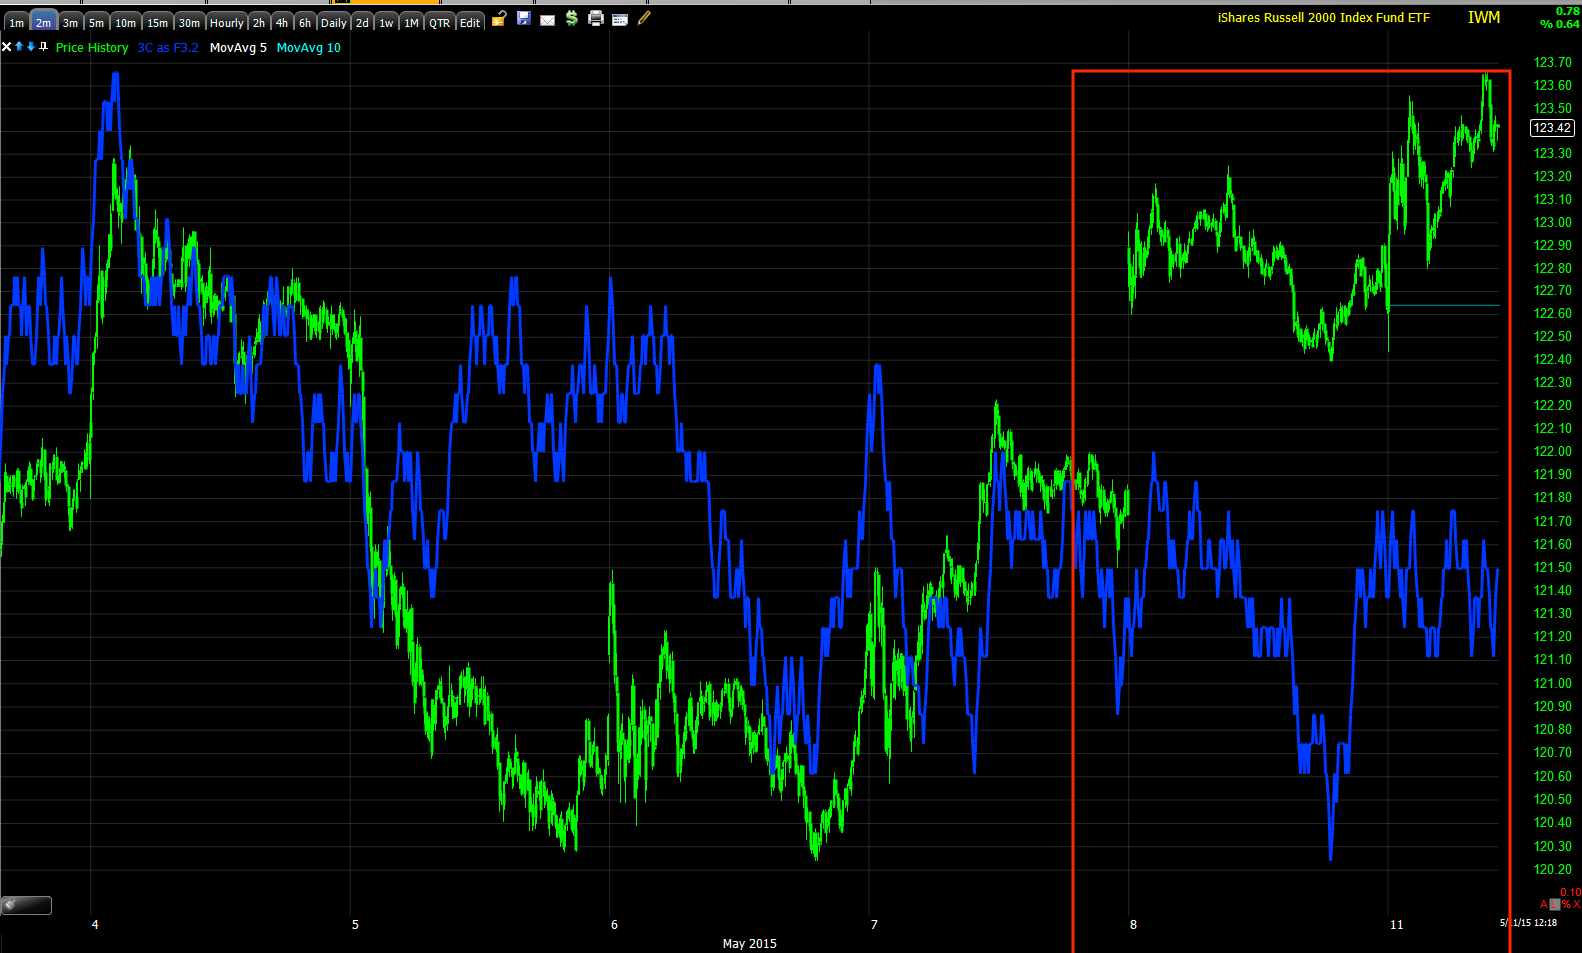
 The IWM which has been the outperformed today also has the same 2 min negative like the other averages, it may have better relative performance, but I still expect it to lose ground as well.

The 1 min intraday IWM chart deteriorating as well today, not as bad as the SPY above.

As for our short term VIX calls trade idea, I fully expect they'll be doing well as the market comes down...
 This 3 min chart confirms the near term signals of the charts above from late last week on the short term timeframes as this is leading positive (VIX trades opposite the market generally speaking).

And the intraday trade on the VXX 1 min is maintaining "in line" or confirmation status so it looks like it is just waiting to move higher with nothing telling me at this point any thing contrary.


There are a few assets I'm watching for potential trades, NFLX seems rather parabolic, it may be worth a put position for a quick trade if we get some decent signals that it is a parabolic move and one about to fail. Initial signs are building now...
NFLX 1 min intraday today as price has stalled sideways and seeing a negative divergence on today's move starting (1 min).

As far as what I'm looking for next other than potential trades like NFLX above, really it will be more about trade management (VXX calls) or some of you have puts on the averages rather than VXX calls. After that, we'll have to see what the underlying trade looks like in to a market decline and if it's worth playing any very short term trades or whether we are best off staying focussed on the larger picture (major market weakness). As I have said, I suspect we will see the market try to put in a wider base as last week's "V" base was almost certain to fail, after that it should try to bounce as the "rates lower for longer" theme builds steam , today with F_E_D data suggesting employment weakness. Oddly though these signals were in place before the NFP or today's F_E_D data...Leaks?

I can't say for sure, but either way, I believe the F_E_D is still on track and very much wanting to normalize policy, they'll just have a harder time justifying it now which is why they introduced all of the subjective language like "If we feel comfortable inflation will move toward the long term...", despite what the actual data is saying. We picked up on these changes the same day QE3 was announced and they have just continued to build on this arbitrary view of macro data so they can tighten policy despite macro data.


Multiple Asset Update: Market, VXX, TLT

So far everything is going according to our forecast on Friday for the start of the week, The Week Ahead. I expected weakness early in the week, Monday specifically. There are some divergences that suggest this weakness will cool off and we'll see an attempt to bounce higher, but in the meantime, we opened Trade Idea-EXCEPTIONALLY SPECULATIVE...VXX Short Term Calls Friday and they are already in the green.

The long TLT/Treasuries, Trade Idea: Long Bonds / TLT from last week is still in place although I expected a pullback today to widen out its base.

I'm going to attempt to show you our expectations for these assets in multiple timeframes and how I'd like to play them as we let the trade come to use, just like the new positions entered last week.

First the intraday Index futures for ES/SPX, NQ/NDX and TF/Russell 2000 futures...
 ES 1 min is seeing intraday weakness in 3C and price has already begun to drop off as expected in Friday's forecast for the very early part of the week, thus the VXX long/Call position as it trades opposite the market.

NQ/NASDAQ 100 futures 1 min intraday falling off badly pre-market and in to the cash open (9:30 a.m. EDT).

And TF/Russell 2000 futures 1 min intraday also seeing a sharp 3C negative divergence.

The averages: SPY, QQQ, IWM

This is the 2 min SPY chart with a deep 3C leading negative divergence which is one of many reasons I was looking for weakness early this week. I suspect a gap fill, maybe a second , small bottom to form a "W" as these sharp "V" bases rarely support much of a move.

This is the SPY 10 min chart , the slightly longer term with the "V" base and accumulation (small accumulation) at its low. I suspect , as I said above, a gap fill, but we'll be watching for signs of accumulation suggesting it is a gap fill and not a total breakdown. It's too early to see any signs of accumulation at least until we get in to the gap area.

This is the QQQ 10 min positive as well, note again the sharp "V" base where the 3C positive divergence was, these are not stable and can't build much on them so it is not surprising that it failed or is failing. I suspect we come down and make another low around the same area creating a wider "W" base, but again we'll need to see confirmation of that with 3C accumulation in the very short term charts before taking any positions based on that theory.

And this is the IWM 10 min leading positive, all of these 100 min charts suggest the market wants to bounce more, but couldn't do it off such a sharp base with little support. Thus my belief we are seeing early week weakness to broaden the area. However that is theory, we need to see actual proof which as I said above, I wouldn't expect at least until we get in to the gap.

All of the above expectations led to Friday's Trade Idea-EXCEPTIONALLY SPECULATIVE...VXX Short Term Calls and those calls are in the green today. At last look they were just moving to a double digit gain.

VXX/Short Term VIX Futures...
 This is the VERY near term 3 min leading positive divergence in VXX which confirmed what we were seeing on the major averages late last week.

 Intraday thus far, VXX is seeing perfect confirmation of the move since the open.

However on a longer term/big picture basis, this large 15 min positive divergence suggests that no matter what the averages might do, create a larger "W" base, attempt to bounce from it, etc... they will fail as this is much larger, much stronger and trades opposite the market. This is a divergence that jumps off the chart/screams and the kind I don't ignore so I'll be looking for an entry longer term for that as soon as this near term trade of gap filling in the averages, possibly a wider base and bounce are complete.

As for the signals in the SPY confirming the same...
 The big picture, longer term trend SPY 60 min leading negative with the worst distribution during the month of April.

TLT/20+ year Treasuries, which are related to this recent trade last week...Trade Idea: Long Bonds / TLT.

Treasuries are breaking down on the primary trend and have seen some deep losses the last 2 weeks, but look ready for a significant counter trend bounce, thus the trade idea above, long TLT/Treasuries.
 This 5 min TLT chart shows the divergence for just such a counter trend bounce. I expected early this week we'd see a pullback (yellow arrows) and so far we have. I believe we'll see a wider base as we only had a "V" base in place as of Friday's close, not enough to support a counter trend bounce as I believe that is what we are seeing right now. The pullback today really was not worth the effort or risk/reward ratio to  try to trade around so I just left the TLT long call idea open and will ride this out.

As for TLT on the pullback intraday today, it is showing the kind of positive divergence/accumulation in the pullback suggesting the pullback is constructive or base building, this is what we'll be looking for in the averages as they reach the gap fill area.

There are at least 3 multiple timeframe trends above, this is what I meant earlier in saying, "Short term" is getting more and more difficult to define, but hopefully this will give you a bit of a road map as to what we are expecting very short term, perhaps to mid week, and the rest of the week.

However these are expectations, I always want to confirm them before entering new positions.


A.M. Update

I haven't made any changes to near term forecasts because I don't see the necessity in it. Although it is becoming increasingly difficult to classify what "near term" is. A year ago near term would be a bounce of 30 days or so or perhaps a base of 1-2 weeks, now near term can mean literally about a day so I'll try my best to give some idea of what these very non-traditional classifications mean, within Dow Theory it would all be considered noise.

The Friday "Week Ahead" forecast was looking for some "noise" in the market to the downside, thus the Very short term , speculative VXX calls from Friday.

There are still charts suggesting we get a bit more upside attempt from the broad market, but this is very difficult to justify taking the risk of introducing long positions and rather looks much better to use to sell in to or short in to. I'll get those updated as best I can.

We also expect a significant counter trend bounce in Treasuries as the "lower for longer" meme has taken hold since payrolls on Friday with March's revision even lower, however the 3C signals for a bounce in treasuries was in place long before the Friday jobs report...something to think about.

Over night the big news was China's central bank, PBoC, cut the 1 year for the 3rd cut in 6 months, by 25 basis point to bring it to +5.1% while boosting the deposit rate by 25 basis points to 2.25% in an effort to get some traction in what has been a lackluster inflationary and growth environment in the world's second largest economy. The Shanghai Comp gained +3.04%/Hang Seng +.51%, but not nearly what the Comp lost last week.

The big story of today and tomorrow is of course Greece in which today's EuroGroup meeting which "should have" unlocked some $7 billion Euros in aid is still at a standstill with the major players / EuroGroup Finance Ministers essentially saying, "Don't expect anything from today's meeting" while Greece is due to pay the IMF $750 mm euros Tuesday. A payment the Greek government says it will meet, however within the Syriza party, the speaker of Parliament, Nikos Filis has said that the payment to the IMF should be dependent on the results of today's EuroGroup meeting with other officials telling Washington that the payment won't be made, which has been chalked up to a bluff, but underscores the internal strife within Syria who was swept to power in elections on campaign promises of reforming the Troika bailout terms and has completely rolled over on all campaign promises.


For the very near term the weakness expected Monday morning is in place, the very short term VIX calls opened Monday (5/15 expiration) will be closed shortly, I'm just going to be looking for the right time.

We expected TLT to pullback a bit today to widen its base before making a move higher (thus the long TLT position).

And USO looks like a very near term bounce before moving lower as we just pierced support last week.

I'll have an early Update out soon, but I suspect much volatility today will come from the EuroGroup meeting and conflicting headlines out of Greece and the various EU finance ministers.