Friday, May 15, 2015

USO / Oil Overview

Today we had another piece of data, not oil inventories, but the Baker Hughes rig count which this week saw its 23rd consecutive weekly decline in rig counts, but it was also the smallest decline since December 5th and the slowest rate of decline in the last 6 months. The total rig count dropped by 8 (some say 6 depending on the source). The actual rig count of operational oil rigs is 888.

Additionally in a seemingly lost bit of data, the Saudis have once again increased production-surprise surprise.

To be clear, I am bullish on oil for the longer term prospects as a significant base that should be sizable enough to handle at least an intermediate uptrend (and with one more pullback to base lows with strong accumulation, a primary uptrend reversal) as such, this is a longer term trend trade that I look forward to entering, but for numerous reasons I have shown why I do not think we are at a sustainable breakout point yet.

If you have read my two articles linked on the members site, part 1: Understanding the Head-Fake Move... How Technical Analysis Went From an Asset to a Trap and part 2: Understanding the Head-Fake Move... Motivation then you are likely able to understand why I said previous to April 30th that a breakout above the base's resistance range (in the USO $20.25 area) would be a high probability and likely needed for USO to back off and complete a constructive pullback that gathers a head of steam capable of slicing through resistance with follow through to stage 2 mark-up.

The charts may be the easiest way to look at the current situation, which I'm fully behind a traceable pullback that leads to a longer trend long position.

 The long term 1 day 3C chart unfortunately is not well scaled because of the relative tight range before the 2014 decline, but I drew in the divergences which you can check for yourself with the most important to the downtrend at a H&S price pattern to the far right of the higher range. After that 3C confirms the downtrend with perfect accuracy and suddenly starts going leading positive. At first I thought this might be a deeply oversold counter trend bounce brewing, but as the base went on and the divergence became larger, it was clear it would have been overkill for a counter trend bounce and it looked a lot more like a base for a trend reversal was being put in.

This 2 hour 3C chart shows the far right side of the base, the second low of a "W" bottom that had a head fake move running stops on March 18th just as it started the most recent trend up and above base resistance at the red trendily, an approx. +30% move. I've shown you other charts to the same effect, but this 2 hour shows the positive divergence at the head fake lows that broke below support on a stop run just before heading higher. The current issue with USO holding the breakout which I suspected before it happened would need to happen for USO to pullback (Failed moves create fast  reversals) is that the 2 hour chart should be in line , rather it shows distribution above the breakout area where Retail traders who have been told over and over by the talking heads on CNBC, "The bottom in oil is in", would have bought the breakout on technical confirmation or the very risky business of chasing price which most technical traders believe limits risk.


 This is the 60 min chart you have probably seen more often showing impeccable confirmation of the price trend until the first tag of resistance and then the breakout above resistance.

 Here's the entire base on a daily chart, it's a "W" base or a Double Bottom.

The difference bbetween double bottom bases now and the ones you see in Technical Analysis textbooks is that TA teaches the second bottom should fall short of tagging support, showing demand. However, once everyone started managing their own accounts with the advent of the Internet and cheap online brokers and the popularity of Technical Analysis went from "Voodoo Analysis" to mainstream in the blink of an eye, Wall St. had Technical traders number as they know exactly how they'll react to any given situation as the precepts or dogma of TA in many cases is decided and even centuries old. Wall St. adjusted, traders did not.

This is EXACTLY why a head fake move like the one in yellow at the bottom of the base occurs, it's an easy way for big traders/institutional money to scoop up a huge number of shares on the cheap without causing any raised eyebrows as the stops that are sitting right under support provide huge supply, thus allowing smart money to accumulate huge supply without driving prices against their position as would normally be the case in any normal supply/demand dynamic.

The breakout to the upside provides the same type of situation just in reverse in which retail traders buying on confirmation of a breakout provide the demand smart money needs to sell in to as they know they'll replace the shares at a lower level, it's the same way we look at these set-ups.

Today USO fell right to support, but I doubt it lasts long before a downside move that should see a significant increase in momentum.

 The 10 and 15 min charts are leading negative at the exact same area, above resistance telling us the same thing. All in all the base is still in good shape, but smart money won't accumulate up here when they can do so 20% or more lower with plenty of supply as recent new oil longs stop out..

Again note the near perfect 3C confirmation of 2 trends before the current divergence.

 This 3 min chart had me wondering a bit if we'd see a bounce Monday off support which is where USO saw some accumulation in small size, a "steering" divergence.

 However looking at the same chart intraday you see deterioration.

Beyond that, the 1 min charts in both USO and Brent Crude futures are negative suggesting they migrate to the 3 min chart and send the 3C divergence even lower. The large picture strategic charts and highest probability resolution are already in place (10, 15, 60 min and 2 hour), it's simply timing charts or "steering" divergences.

Here's the positive at this morning's opening low and distribution in to the afternoon right at yesterday's close.

In a near picture perfect image, the Brent Crude Futures 1 min chart show the EXACT same thing, a small positive at morning lows and distribution in to the close and at about the same rate.

Where USO pulls back to is another matter entirely. Initially I suspected to the low end of the range, but it could be somewhere around $18.75. Wherever it pulls back to, it will need to do some lateral work to repair those longer term charts and gather enough of a head of steam toils through resistance convincingly this time with follow through the days just after.

2 decent looking trades that dovetail in to each other.

Daily Wrap, Additional Details and Additional Asset Updates Coming

The Week Ahead

I feel that we'll definitely be moving toward the 3rd trend forecast from last week, the one that comes AFTER the bounce.

I don't think the bounce is quite complete or its reversal process is not quite complete which means that my first assumption would be that the market would be rangebound and choppy in the area finishing the reversal process, but we also have some very easily recognizable resistance areas that are a hot bed for a head fake move, I have not doubt any head fake move or false breakout would be exactly that.

It's hard to say which scenario is more likely, but the Index futures have turned definitively and unambiguously negative.

Here's what I'm looking for and why I think we may not be at the next trend yet...
 In the simplest terms, the 15 min SPY is already very negative, distribution.

It's the 10 min bounce chart below that looks to me to need a deeper divergence which it wouldn't get on an op-ex pin today.
 SPY 10 min which is the gas in the tank for the bounce expected this week, it has turned negative, but needs to be leading negative like the chart above with no question.

 The 3 min charts' trend shows it has been and continues to head that way, I don't think that changes next week.

The same is true using QQQ as an example-the 10 min bounce chart needs to fall apart more before the next trend/DOWN

The 5 min chart is showing clear, heavy distribution and migration that way, I suspect it will take a couple of days to sufficiently kill the 10 min chart.

As for early trade next week, we don't have any strong signals, this IWM 1 min is the closest thing and it's negative suggesting some early downside, but in the IWM only. This would fit with the idea of range bound action as the reversal process finishes up.

 Looking at VXX it looks to be half way through (or more) its reversal process, but not completely there yet.

The 10 min chart is strong and leading, it just needs the short term reversal process above to conclude.

My word for early next week is PATEINCE.

Transports Trade Set Up

This is already one of our core (trend) short positions with at least 2 previous entry areas since identifying the 2014 change in character which leads to changes in trends.

Transports have shown abysmal performance as of late and on the year to date, which makes it very difficult to justify a new entry for those who may be interested as we want to short in to price strength and underlying chart weakness, but if we never get the price strength we are essentially chasing the trade and that doesn't bode well for a trend position in a market that is as large laterally and as choppy as this one is (indicative of the topping process).


 The major averages YTD with transports in salmon lagging significantly.

The averages over the last week, again with Transports lagging significantly.

The averages intraday today so far with Transports leading as everything else looks pinned in place for options expiration.

 This trend is a great example of a stage 2 trend in mark-up before the mania phase as it peels away from a long term trend/average as it did on a Crazy Ivan shakeout (below the trendily which gives it a lot of momentum for a move above the trendily and that's where price peeled away ringing warning bells). 

This is a nice example of why we try to fit a trend inside our custom indicator, the Trend Channel as soon as possible. Although we have a lot of different tools (as well as your favorites) at our disposal and sometimes they'll give better entries and exits, with the Trend Channel there's no guessing, there's no arbitrary decisions. The stop is based on objective evidence so you aren't wondering whether it's time to take profits at each new swing higher (or lower).
This was one of my fist custom indicators and the first one I won an award for. Originally I was trying to do something automated along the lines of the Turtle trading system, but after years of back testing every known system I've been able to program in to my backscanner and hundreds of my own creations, I've realized that there are few systems that are robust enough to work through multiple market environments and the only ones that are have draw down periods that are so significant I doubt anyone has the emotional fortitude to stick with the system  as well as to stick to the rules which only allow a couple of trades a year- most traders feel they have to be much more active than that, but the system worked, although it doesn't matter if people can't abide by it.

The Trend Channel is not like Bollinger Bands or Envelope Channels, it self adjusts to each assets own volatility and creates a channel that is a certain standard deviation outside of what would be normal. The Trend Channel can and will adjust to natural changes in a trend , it will allow for pullbacks/consolidations, etc. However when it does give a sell or cover signal, I have found you are best off taking it and any further gains (as the Trend Channel by function will never take you out at the top or bottom) are usually dumb luck while you are typically best served moving you money to the next idea. 

As you can see, the Trend Channel held the entire trend in Transports for 2 years without 1 single day's false stop-out signal. The stop out came at the red arrow on a closing basis and since, it has travelled in a lateral choppy range, in other words it captured the trend and exited before it turned to a lateral chop-fest.

Remember these changes of character lead to changes in trends, and that is clearly the case with transports as they have been lateral ever since with a slight drift to the downside.

 Here's a closer look at the daily chart

 The long term and strong daily 3C chart of Transports had been in confirmation of the stage 2 uptrend and if you look close 3C goes negative right before the Trend Channel Stop-out. Since it has seen a deepening/worsening distribution trend that was relative negative and now leading negative which is the stronger of the 2 underlying trends.

This is not a stock that I want to trade long for more than exceptionally short period and it would have to have unbelievably strong long/positive signals as the highest probabilities are represented by the 3C chart above (Down).


 The 2 hour 3C chart is largely in line with the trend, although I did take the liberty of marking some of the smaller divergences that led to swings up and down, however as I said, the main trend has been downside confirmation.

 Very recently and VERY quickly there was a burst of accumulation, it is no where near a stable base or anything I'd personally consider as a long as it is too unstable and unpredictable, but nevertheless, we have a 15 min leading positive divergence which I confirmed in essentially a single day (just a tad longer).

 So far the trend has been able to maintain close to an inline status although there are signs of some profit taking.

This move would not have been possible without a head fake move/stop run which I'll show below.


This is the 1 min intraday chart, again for the most part it is in line on its first day of upside, but while a 15 min divergence is impressive, especially one that develops in little more than a day, it's still only a day's worth of "Gas in the tank".

Under no circumstances do I consider this any kind of bullish trend change. If anything, Transports are likely getting this boost so smart money/intitutional money or 
From left to right join a daily chart, there was a support area from early 2015, stops and new shorts would be lined up to execute on a break of that trendily as happened at the first yellow arrow/head fake move around the middle of the chart. Note the increase in volume as stops are hit and new shorts enter on break of the trendily confirmation. However by days's end the supply created by stops and short sellers had been accumulated and pushed back above resistance creating a squeeze which ended with a "Shooting-Star-like" candle in red on increased volume. Volume doesn't need to be huge, it just needs to increase and these candlestick patterns (bullish or bearish are about 3x more effective than without the higher volume).

A new support trendline was created and that was followed by a Shooting Star on increasing volume sending price back down. Yesterday on the 15 min leading divergence above, price ran stops / new shorts with a head fake move (yellow arrow to the far right) below the trend line with a significant increase in volume (indicative of stops being hit and/or new shorts moving in on trend line break confirmation). As with most head fake moves, this creates momentum as new shorts are squeezed, sometimes new longs will come in if the move is strong enough to attract their attention.

I'd like to see a move to the $160+ area, but we'll listen to the market and watch the charts for signs of where/when this move loses its gas, AT THAT POINT, WE SHOULD HAVE OUR NEXT AND PERHAPS LAST TRANSPORTS TREND POSITION SHORT ENTRY.

NFLX Update

News of Jack Ma/NFLX meeting sent it above the psychological magnetic level of $600 in pre-market, op-ex pin related news or not, the charts are what I'm interested in.

Any new divergence such as selling in to a gap up like this will start of the fastest timeframe chart and as it builds strength it will migrate out to longer timeframes.

So these initial charts are interesting as it seems someone is not so convinced about the China news.
 The initial opening confirmation gave way to a relative negative divergence that has sent NFLX trading laterally since which has led to a stronger leading negative divergence which are commonly seen at flat ranges like we have seen since about 11 a.m.

The initial migration signal has made it to the next longest timeframe 2m leading negative.

I'll continue to watch to see if this divergence continues to strengthen.

TLT Position Management / Trade Set-up

As you probably know last year's golden child asset, bonds are this year's pariah. It was very interesting to see 3C confirmation on 60 min charts through most of 2014 until late in the year when we backed off the position that bonds should keep rising and wondered what was next as it didn't look like the support for more upside was there any longer on the long term 3C charts.

In any case, the original Trade Idea is filled with charts and the concepts that make a TLT counter trend rally or bounce very attractive, Trade Idea: Long Bonds / TLT. Here are some additional charts and a lot of concepts that we use with any asset in any timeframe, fractal concepts, Bond Rally / Swing and here's yesterday's most recent update, Quick TLT Update.

This excerpt below is from yesterday's update as TLT is up nearly 2% (benefitting our original partial position), however I knew there was a risk in not filling the trade out yesterday...

"If I were filling out the second part of TLT as planned in advance with TLT long or TBT short, I'd have little issue with doing it here.

As it is though, I'd like to use the June 19 calls so I'm looking for one last thing that we see about 80% of the time before a reversal, a head fake move and in this case it would be a stop run. I may miss filling out the position, but for options, this gives you a nice discount, lower risk and the best timing we can get from price based signals."


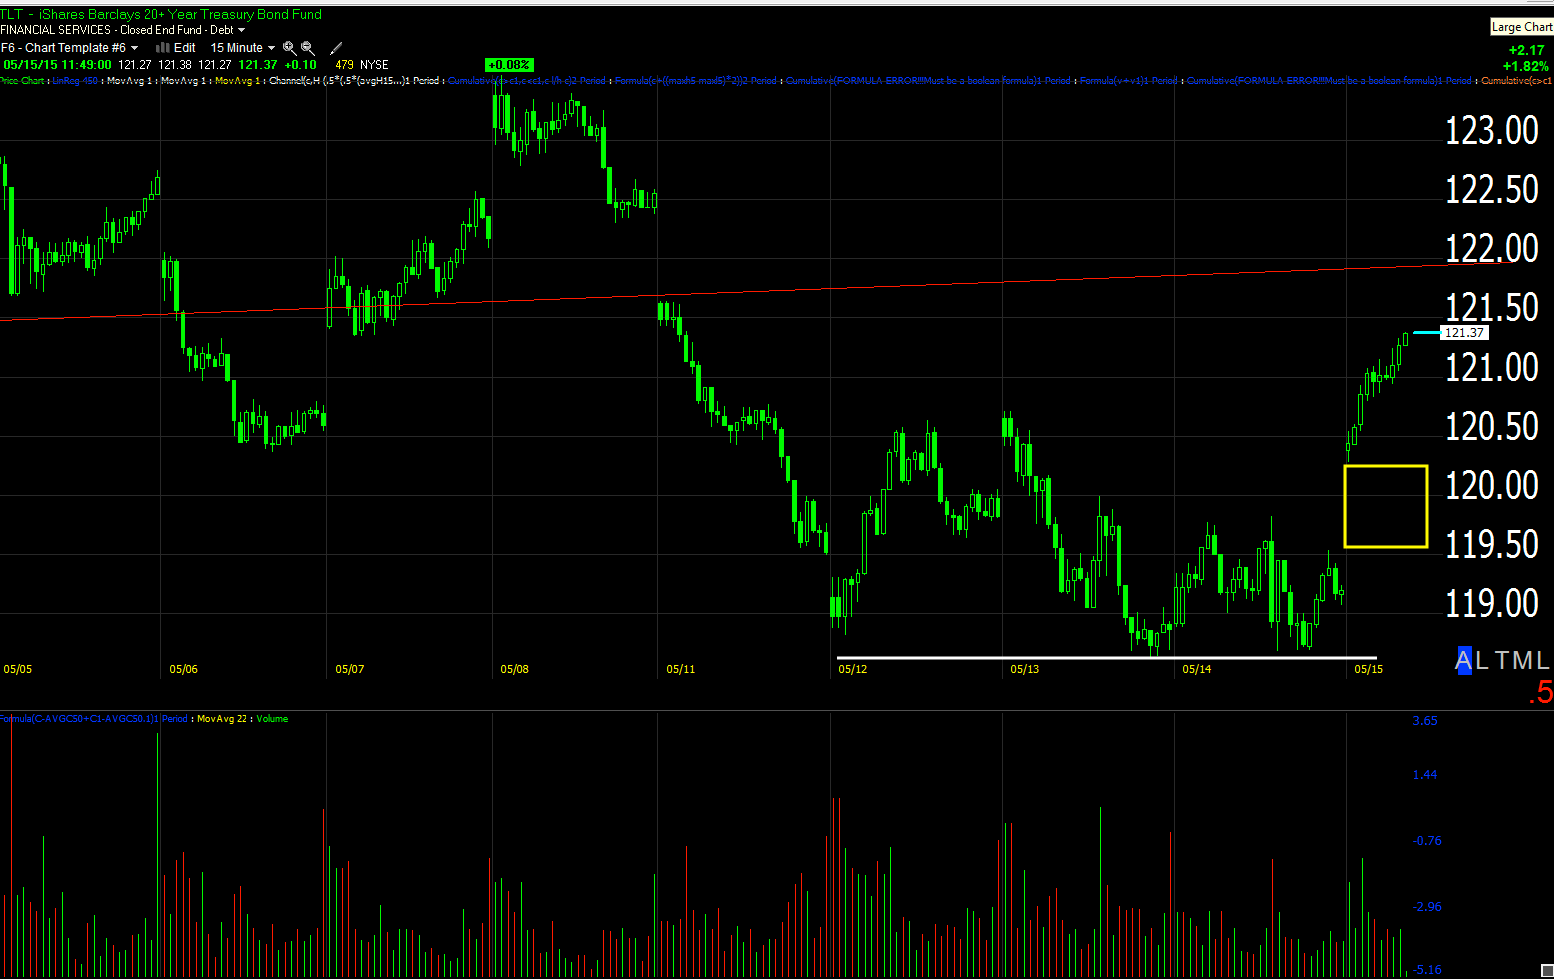
Despite today's move up, we are still in an excellent overall position and we still have a decent probability of filling at lower levels, however even filling here should lead to a more than satisfactory gain on a counter trend rally.

 This break of a long term trend line and why it often leads to a counter trend move is explained in the first post linked above . I suspect these are our two most likely upside targets so we are still below the trendily and have plenty of room, but I don't think it's a wise idea to chase a trade, rather let it come to you.

Here's a closer look at what we were looking at yesterday, the reversal process from an suspected pullback is in place. A run on stops as this trade idea seems to be getting a little more popular than I'd care for would be most appreciated and offer an excellent entry or add-to once the move is confirmed as a stop run/head fake which it almost certainly would be. In yellow we have today's gap. Over the past 5 years or so the market has been ruthless about filling gaps which I prefer it wasn't, but in this case that may be helpful.

 This is the 30 min 3C chart from negative to confirmed downtrend to accumulation for an obvious counter trend rally/bounce.

The first position was entered on the 7th, but only at half size as I suspected the base was too narrow and would pullback creating a more stable base which it did so we are still at a decent area theoretically to add, although as I said, I won't chase a trade.

 Tjis 3min chart shows the first entry and the next day the divergence on a gap up for the pullback that was suspected with the reversal process and positive divergence taking place confirming the "larger base" theory of the 7th.

 This 5 min TLT chart shows an impressive divergence, I can't imagine this would be anything less than a counter trend rally and within a downtrend (as is the nature of a counter trend rally), these can be some of the strongest rallies you'll see as we are getting a glimpse of today at nearly +2% for TLT!

So far intraday we have good confirmation, but I'll be looking for signs of a possible pullback, it is an op-ex Friday and things may look quite different early next week. Either way I'm sure we'll fill this one out and it will be well worthwhile.

Early Market Update

In last night's Daily Wrap I showed the intraday charts of the averages and mentioned the concept of 3C charts picking up where they left off the next day (cash market) even if that was over a long weekend as well as mentioning the typical op-ex pin we see near the close Thursday and handing around the area until about 2 p.m. Data is kind of stagnant during that time as it seems most of the intraday divergences are steering divergences to keep the market on the max-pain pin (where the greatest dollar amount of options will expire worthless. However after 2 p.m., it tends to be a treasure trove.

The question I was interested in last night regarding the 3C concept of picking up where it left off was answered definitively this morning on the cash open.

 The charts looked like this for all of the major averages, a very clear divergence on the intraday chart. Typically (Even over a 3-day weekend), the divergence would play out on the cash open of the next trading day.

 QQQ 1 min with yesterday's short squeeze and clear divergence almost exactly like the SPY above and IWM.

The overnight session saw Index futures push higher with a negative divergence around 6 a.m. this morning and the concept held true right at the cash open (white arrow).

Beyond that, we have what I showed in the A.M. Update which is nearly a full house of negative divergence through nearly every timeframe in Index Futures which didn't make a lot of sense with $USDX futures, but that may be being dealt with right now, not to mention the crossed correlation yesterday. I'm not jumping to any conclusions with correlations just yet, but the Index future charts look exactly how we expected them to look on a bounce in the \"week Ahead" forecast from last Friday as the next trend described...

"I'm still expecting a $USDX led bounce in the equity market as well as the bond market, certain stocks are going to be shorts before others, but this gives us a chance to open or add to any positions we may want to tweak a little.

As I have tried to make clear, it doesn't look like smart money is even participating in this move, thus my own participation level is so low at present having closed VXX puts today.

In comparison to what comes next, this bounce is nearly meaningless like Monday morning's forecast.

The main theme is strong market weakness and any chance we get to open or add to positions we like should be taken. There's simply no comparing the "bounce" charts (of the bounce expected) with those of the distribution and broad deterioration through all of 2015"

 Intraday that 1 min chart above of the SPY is perfectly in line, not uncommon on an options expiration day until they need to adjust the max-pain pin a bit then we might see a "steering" divergence on an intraday chart like this.

However the trend (2 m) is quite clear since last Friday (red on the time axis). You can see the short term divergence Friday which led to there forecast for "early in the week weakness", which I expected would build a bit of a stronger positive divergence at the Tuesday a.m. lows (yellow), that didn't happen. The distribution trend from there is quite clear.

This is the longer 5 min QQQ chart showing why we suspected a bounce this week (with the earlier chart's divergence above to occur first-early in the week weakness followed by a bounce based on the chart above). The positive divergence or accumulation at last week's lows was for a bounce, it was just very "V" shaped and they don't usually hold well or for long, thus the expectation we'd see a wider base and another positive divergence at the lows on Tuesday morning.  The QQQ chart has this positive divergence out to its 10 min chart so we want to see that fall apart as the 5 min chart is doing presently, ALWAYS IN TO HIGHER PRICES. I suspect this 5 min chart will worsen and will migrate to the 10 min chart, especially given the shape of Index futures.

Another hint is VIX assets...
 The near term VXX charts are improving and much more dramatically which is needed for timing (VXX 2 min).

XIV which is the inverse of VXX-short term VIX futures) has deteriorated all week which is additional confirmation of the VXX charts, the market averages and the Index futures.

 This is the longer trend/stronger in XIV 5 min which was perfectly in line or price/trend confirmation at the uptrend at the green arrow. Then a lateral move in price and the first relative negative divergence followed by a stronger leading negative divergence. The 10 min chart is the bridge between this divergence and the longer 15 min leading negative shown yesterday which is the mirror opposite of VXX's 15 min which is not a function of it being an inverse ETF because although the inverse ETF has to match price (inversely), it doesn't have to match volume  which is a measure of demand that 3C uses. In other words, if there weren't actual confirmation of the VXX signal, it wouldn't have the opposite divergence.

VXX 10 min is leading positive and bridging now to the 15 min chart. That's when I want to look at a longer term VXX long position, not to say options can't be used, but there's more trend to capture once the 15 min divergence fires.

 VXX 15 min leading positive.

Which has stunning confirmation in VIX futures.
30 min VIX futures leading positive. The divergence is actually much larger, I just can't get more time on this chart.

I'll be looking around for any interesting signs, usually the first half of Friday's is pretty slow with the op-ex pins, but you never know what you'll find.

A.M. Update

Good morning.

After another night of futures rallying, they are coming down a bit now, my guess is that they are coming down close to the area of yesterday's close as that seems to have been the theme for options expiration max pain pins.


Even though our Week Ahead forecast was actually dead on, as I said earlier in the week, I wouldn't try to catch a bounce unless there were supporting signals which never developed. There is a ton of damage/distribution in to any higher prices this week.


 NQ 10 min from Friday with the start of a divergence (we expected more this week) that represented the higher prices through the end of the week, the early in the week lower prices or weakness can be seen at Monday and Tuesday morning and then the bounce we forecasted Friday with distribution through the entirety of it and no additional accumulation through the entire week, even at weakness/lower prices Mon.Tues.

 ES 10 min with a stronger trend, distribution almost throughout.

 And TF 10 min showing very clearly the divergence last week that caused the call for early week weakness followed by a bounce, but that has seen strong distribution signals as well on a very strong timeframe. All of the Futures timeframes for the most part are now aligned negative. This is exactly why I would never be long with signals like this.

 NQ 30 negative

 TF 60 negative

 ES 1 min intraday seeing some downside from overnight gains.

 The $USDX looks like it is ready to start the counter trend bounce we have been expecting which should be interesting as far as correlations.

As such Treasuries should be near ready as well
 Gold Futures with an extremely negative divergence through this parabolic move...

And currently oil is getting crushed.

We'll look for the cash market signals and the op-ex pins end. I suspect we are in for some interesting antics, but also some nice new positions. With distribution like that and so little support, I wouldn't want to be long with free money.