Thursday, December 1, 2011

USO Update

 USO's last 2 days of performance have been lackluster and trailing the S&P.

 I said I would hold my Oil shorts unless something major happens or a new high is made, thus far it seems the doji star reversal has provided resistance.

 The USO 5 min chart doesn't look very strong here.

 The 10 min chart shows an obvious divergence at yesterday's opening highs.

 And the 15 min chart remains very negative in a leading divergence, the reason I have been willing to hold despite all that's happened in the middle east. It could be that China's pullback in manufacturing could effect their consumption of oil.

 The 5 min SCO (Crude Short that I'm holding) looks like it want to bottom here.

 As ugly as the USO 15 min chart is, the SCO 15 min chart looks great.

As does the 30 min.

For now, unless something changes here or my stop is hit, I'm going to trust in these charts and stay short crude.

Risk/Credit Basket

 The CONTEXT model has been all over the place, but the model is diverging badly with ES right now (The Model represents where ES should be compared to other risk assets so ES/S&P would be considered overvalued or as I would call it, dislocated).

 Commodities have been the stronger performing risk asset this week and you would think even more so with the announcements yesterday out of the Global CBs as well as China's, but today commodities have not been able to surpass yesterday morning's opening highs. They are now dislocated from the S&P.


 Here we see the JJC Copper Index opening lower today and diverging with the market.

 USO opened lower as well and has been unable to surpass yesterday's a.m. highs as it leaked lower all day.

 High Yield Credit still hasn't passed last week's highs and although it is difficult to see, unless you compare the green S&P and where it was back then as opposed to where it is now, there is a major dislocation in credit.


 High Yield Corporate Credit has been performing well this week, today seems to be the first day it has broken with the S&P thus far.

 Here's a larger view.

 Financial momentum rallied bak hard yesterday, especially into the close, today it is diverging lower thus far.

Finally yields have not broken above Monday's highs and remain dislocated all week from the S&P.

More updates coming

Overnight

The overnight action in Europe was largely positive, there were successful auctions of debt out of France and Spain and the yields on 10 year Italian BTPs broke below the red-zone of 7%, Spanish bonds  are close to breaking below 6%, this is good news for today and apparently brought on by yesterday's liquidity action although it has no effect on sovereign debt, only liquidity funding costs for EU banks.

There were rumors that this liquidity action was taken yesterday because a major EU bank was about to fail, this morning it seems that bank may have been Credit Agricole.

Overnight the big news was China's manufacturing base entering contraction with a sub 50 PMI print, probably explaining their lowering of Reserve Requirements for banks yesterday.

In the US this morning, Initial Jobless Claims jumped back above the 400,000 mark at 402k (consensus was 391k), the previous print was as always, revised higher from 393k to 396k.

ISM beat at 52.7 (consensus 51.8) however, mirroring the IJC above, the employment index fell from 53.5 to 51.8 which doesn't bode well for the Non-Farm Payrolls.

Wednesday, November 30, 2011

Daily Wrap

So we start tonight off with confirmation of what I've been saying commodities have been telegraphing and all of the sudden, China's move to cut the RR ratio for banks is seen in a whole new light.

Chinese PMI comes in at 47.7 on consensus of 49. A number below 50 represents contraction and this would happen to be the biggest contraction in 32 months. What started out as a knee jerk response to China's policy cut has turned in to confirmation of not only problems in housing, but their manufacturing base as well; certainly this is partly contagion from Europe, their biggest trading partner. Just about everything in the report was weak, New Orders, New Export Orders fell and inventories rose a lot.

Corning, a big player in the LCD TV market came out earlier today with a release that hinted that Black Friday was such a success because retailers and producers were selling at a loss, with inventories up so much in China, it's not hard to believe.

Also making the rounds tonight, Golman cut EU GDP forecasts from .1 to -.8 which equals recession.  As a reminder, S&P ratings said that would be enough to downgrade France, praise to Egan Jones who downgraded France today, as usual they are ahead of their peers.

The Mid-East conflict also escalated late today with a Chinese professor with the National Defense University saying, "China will not hesitate to protect Iran with a 3rd World War".

I knew the situations from the EU to China to the Mid-East would escalate fast, but I never envisioned this.

ES is vacillating between a point and two points down.
 However we have a new leading negative low in 3C.

The Context Model continues to leak lower.

Here are a few interesting charts I picked out tonight.

 First we have my Demark inspired indicator giving the first 60 min sell signal that we have seen in quite some time.


 MoneyStream is a powerful indicator, it gives few signals, but when it does, they are solid. Here are the negative divergences in MoneyStream - above is the DIA

 Here's the QQQ

 The S&P-500

 The SPY and I don't know where the chart disappeared to, but the entire NASDAQ Composite as well.

 Here's a negative 5 min RSI on the ramp close, which I have a feeling is a bull trap, we'll see.

Even though 5 min is enough time, I gave it the benefit of the doubt and it was there on 1 min too.

Here is the real stunner though.

Volume Analysis is becoming a lost art form, but an important one. The rule is stocks need advancing volume for a healthy rally, but stocks can fall of their own weight, volume is never a prerequisite for a decline and a bear market hallmark is in fact low volume. The only caveat to that rule has been when F_E_D intervention by pumping billions of Primary Dealer dollars in the market, kept it afloat during QE periods, however that is over and recent events make QE3 more difficult to pull off, not to mention the F_E_D members are openly disagreeing with each other in same day speeches on the policy tool's effectiveness which other then the "wealth effect" of higher stocks, has been about ZERO, GDP has declined from its peak, unemployment is persistently stubborn, and just about any other metric you choose has shown it can do 2 things effectively, ramp the market and ramp inflation.

 Here's a long term view of a healthy rally on increasing volume, note when volume dries up, the market pulls back or tops.

 So along that theme, today I put up my cumulative volume indicator which simply adds yesterday's volume to today's and creates a cumulative line, I was using it to look at some price patterns to try to see if they were random or real when I stumbled on this. The S&P-500 over the last 3 days of rally has seen the LOWEST VOLUME in more then a year. That's right, out big price gain came on extraordinarily low volume, you can see the blue cumulator of volume at new lows as well as a 2-day average of volume in white.

 In fact, it's the lowest since a minor top, similar to this week, way back in early 2009, the 2 day average of volume goes back to 2009 as well for lowest volume.

 It wasn't just the s&P though, the NASDAQ 100, also lowest volume since 2009.

 The entire NASDAQ Composite-every stock trading on the NASDAQ network!

And the Dow 30 has had a couple of lower days, both at tops.

So today? Sugar rush, knee jerk response or the start of a strong rally? You know where  come down on the issue.

Here's a snapshot of US futures as of 11 p.m.

Pretty darn flat thus far

We'll see what the 3 a.m. EU open brings.


Quick ES Update

I'm still gathering charts for my end of day wrap, it will be worth the wait and my time, but for now, I want to show you ES, remember what I said about the late day ramp in the market.

 Being I can only access our Risk/Credit indicators during market hour, I will use the broader, less specific CONTEXT model for after hours.  The model has leaked lower as I suspected would happen after the late day ramp, which I believe was there for one very manipulative reason, it wasn't on news. In any case, the model is diverging in afterhours.


Here's ES trade on a 1 min 3C chart from pre market to present. Note how the negative divergence in the early hours of the morning kept ES lateral throughout the day, a pretty linear trading range, no additional gains except the very end of day. ES is now about a point lower then the New York Close and as  suspected, right after the close, 3C went divergent again and ES has dropped as I mentioned, a point off the close.

I may set my alarm at 3 a.m. to see what happens, but thus far the market' inability to add to the gains sets up a loss of momentum and that will be addressed in my larger post later tonight. I've discovered a few things that will truly surprise you.

Today's Event of the Day


As you probably know by now, last night China lowered their banking sector RR ratios, this only a few months after tightening due to inflationary pressures that were causing riots in China. It is or was assumed that this was in reaction to the meltdown in Chinese real estate, however at 8 a.m. EDT, a Globally coordinated Central Bank intervention was announced with F_E_D, the Bank of Canada, the Bank of England, the Bank of Japan, the European Central Bank, and the Swiss National Bank all taking part.

The FED is loaning directly to the ECB so presumably there is no counter-party risk, however with the F_E_D's discount rate at 75 basis points and the swap line which was reduced today from 100 basis points to 50 basis points, add the OIS (Overnight Indexed Swap, which is an overnight rate calculated based on an index- which generally speaking is cheaper and less risky then the interbank lending rate known as LIBOR which is the rate banks charge each other for overnight loans) means that it is cheaper for European banks to borrow from the F_E_D then it is for US banks- by approximately 15 basis points, an odd detail.

Of course the whole purpose of the policy action taken today was to make bank borrowing in the EU cheaper as they face what we have been talking about for some time, a liquidity squeeze as the same dynamics from the US in 2008 replay, interbank lending has completely frozen in the EU due to 'counter-party risk” or the risk of lending to a bank and having that bank go belly up or not be able to repay the loans. The key words to the coordinated policy action today are simple, "liquidity freeze" and "EU Bank Borrowing Costs' and this is a big problem. If a mere 50 basis point reduction was so needed, there must be real problems within the EU Financial sector. As we have already talked about, Italian banks are not immediately allowing withdrawals by customers of over $2,000 Euros. Instead an order had to be placed by the customer and the bank would notify them when the money was available.  This was curious, but we uncovered the reason a few days later. Italian banks are so locked out of liquidity markets that they resorted to a VERY odd solution-they are borrowing directly from the London Stock Exchange, which is using traders funds to supply Italian banks with the money needed at a premium on 3 day loans. Thus the reason for the wait, as the London Stock Exchange is deriving something like 15% of their income from these transactions, obviously the Italian banks do not want to borrow any more money then they absolutely need, it's somewhat akin to "Just in time inventory management".


It should be understood that the F_E_D is not bailing out Europe through the new swap line agreements, but they are trying to reduce the stress on the highly leveraged EU banks ( as mentioned before, unlike the US, they are leveraged 26:1 making a 4% decline a total wipeout of equity-a major concern). It's also important to understand this is not sovereign lending, it's making borrowing for banks cheaper as they already face hurdles in raising their capital base as the EU has demanded-remember how many US dollar denominated assets the EU banks have liquidated which supported the Euro as dollars were sold and Euros were bought to repatriate the capital. The sales were obvious in the Primex market offered by Markit as well as USTs and most likely US equities and fund redemptions. 

Further evidence of this was released today by ICI (Investment Company Institute).  Domestic Equity Funds just saw another $3.8 billion dollars pulled from Funds and thus the market. This is the 14th consecutive weekly outflow (totaling $44 Billion) and the timing is about right as compared to the EU banks ordered to recapitalize, which means that they need to raise just about the same amount as their combined market cap. As we talked about, they refuse to issue shares to raise money as they are trading below book value, instead they have opted to sell everything not nailed down and it wouldn't surprise me at all if some of these outflows from domestic funds were being repatriated directly to EU financial institutions. The consecutive outflows would actually be 31 weeks if it weren't for 1 week of inflows of less then a billion dollars, the total for 31 weeks is $130 billion dollars.

While this tid-bit is slightly off topic, it does show the power of the F_E_D's QE program to levitate the market as well as inflation. Since 2010, the market has lost $214 billion from Equity Funds, yet the market climbed higher due to the arrangement between the F_E_D and the Primary dealers which were flipping bonds to the F_E_D (in some cases only holding them for a week) and in return earning billions of risk free money that was put to work in the market, mostly in the most heavily weighted stocks. Note what the market looked like (a top) at the end of QE 1 and note what the market looks like now (a top) after the expiration of QE2. Here's flow chart of funds incoming or outgoing vs market performance.

Note that while money was flowing out in 2010 during QE2, the market kept rising. Look at what happened after QE2 ended with outflows, the market dropped considerably. The October outflows were substantial compared to the median and this is around the time the EU banks were selling everything.


I digress...


While the break-up of the EU may seem far-fetched, Germany has certainly been making movements that could be construed in many different ways, almost all would either disband the EU or cause the EU to fail. In the F_E_D's new agreement, which is posted at the New York F_E_D website, there is no mention of who would be responsible to repay funds in the case of an EU breakup, something I'm sure Ron Paul would like to ask Bernakacide.

The statement by the F_E_D added the following:

U.S. financial institutions currently do not face difficulty obtaining liquidity" but if conditions deteriorate the Fed has tools which they "are prepared to use,"

Today it seems this has been widely interpreted as Too Big to Fail banks such as Bank of America, could be rescued if need be, but it is more appropriate to read the statement in the following manner, “ If US banks face a liquidity crunch, the discount rate could be lowered from 75 basis points. If financials saw any strength from the initial interpretation, they would most likely be very mistaken as the F_E_D would be very unlikely to address bank failures at this time and within the context of the policy action. Still it is strange that EU banks can borrow from the F_E_D cheaper then US banks. This must speak to the financial conditions in the EU being a lot worse then is currently thought.

It would also be important to consider that the F_E_D may be charging a slight premium as US banks can borrow directly from the F_E_D's discount window which carries some degree of risk, whereas EU borrowing is by the ECB, less risky then an individual bank.

One of the strangest features in the policy action is the framework set up, but not activated, that would allow US banks to borrow Euros, Yen, Loonies, Pounds and Swiss Francs directly from the F_E_D. Policy changes by the F_E_D are not arbitrary and this curious feature was put in place for a purpose in which they could be activated in the future, the question is why?

In the NY F_E_D's FAQS here is what they have to say:

Why is the Federal Reserve establishing lines for these five currencies and with these five central banks?
These five currencies are used globally and account for the bulk of the foreign currency funding of U.S. financial institutions.

This is curious and a bit alarming.

Today's reaction certainly seemed to be a knee jerk reaction and we saw many indications of that. Just as a reminder, here's a chart I posted earlier today which depicts the last time there was a globally coordinated central bank intervention...


More coming, I've uncovered some interesting charts sniffing around today.

CREDIT/RISK Indicators

These are all zoomed so you can see today's action, in earlier posts you can see that many or most are much lower then the market and thus already dislocated, the end of day rally is interesting with these indicators.

 Here's one of the most interesting charts especially at the EOD ramp, credit went the exact opposite direction as the S&P ramped in to the close, which I usually suspect is to cement longs in place and get retail that comes home from work to enter long orders and thus becomes a set up. If there was some real risk on reason for the ramp, credit would have moved up, at bare minimum stayed flat, but not move to the lows of the range.

 You can see just how disconnected and emotional the market is today by looking at the normally near perfect correlation between the EUR/USD, the Euro should be the one rallying after today's announcement, instead it leaked lower all day and at the EOD ramp.

 Rates, same story.

 Financials did see good momentum toward the EOD and that may be because they are the most obvious short target as today's operation was not a EU fix, but a helping hand to banks in reducing the rate of interest they pay to borrow capital.

 Commodities which have been outperforming recently and which should be the beneficiary of today's policy intervention actually showed the worst crack all week, look at the difference in the afternoon trade, that's a divergence.

And that now put's commods in a dislocation.

Closing Update

I'll try to pull up the risk/credit charts too if I have time. Also if I have time, I'll probably add to at least 1 financial short, this is because of time restraints as the MP is my last priority. I'd also like to look at breadth, but that will have to wait until later.


 DIA 1 min, zoomed in, just nothing positive going on there today, a slight positive divergence toward the EOD, the first of the day which is typical on a late day ramp for a day like this, hopefully I can add in time.

 The 5 min chart is just a disaster, no attempt to even get close to confirmation, this looks like  VERY weak underlying trade.

 The 10 min which I don't have on stockfinder, only TC with a limited historical view, but still the fact 3C can't move up beyond yesterday's highs on a 3.5% move and the fact it has been stair-stepping lower all day.

 IWM 2 min, didn't even move past this week's highs at much lower prices. This is obviously leading negative.

 The 5 min chart didn't move wither, it should be where the blue arrow is at least.

 The 10 min againcan't move above yesterday's highs, very weak.

 The 15 min just stair stepping lower.

 QQQ 1 min zoomed in shows a few positive divergences

 You can see how far out of line it is though on this zoomed out chart.

 The 5 min couldn't make a new high or and is leading lower.

 Same with the 15 min.

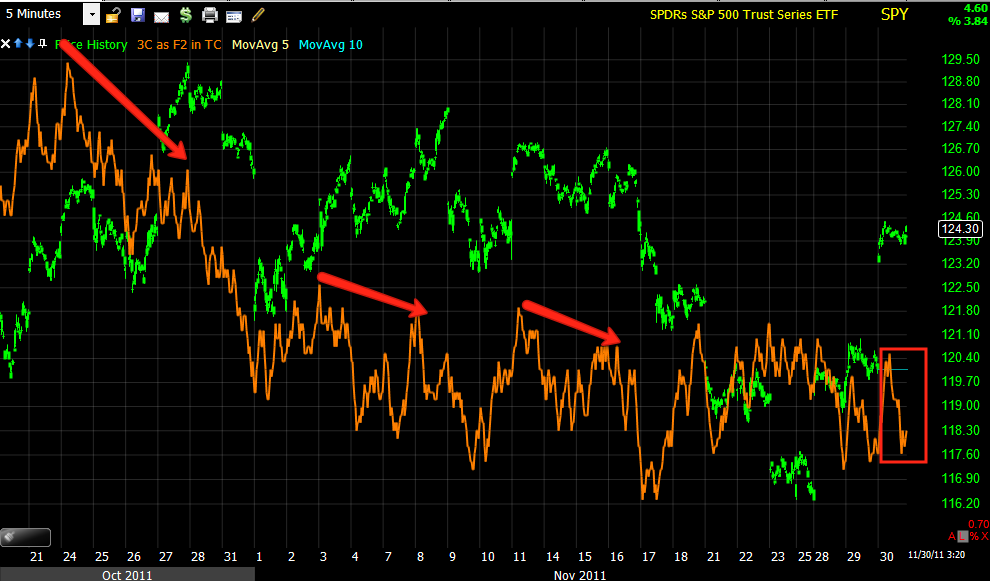
 SPY 1 min, speaks for itself.

 The 2 min is even worse moving lower.

 Zoomed 2 min with a slight positive EOD divergence.

 The 5 min couldn't move above anything this week at much lower prices.

 Zoomed in it is lower all day with a slight positive toward the EOD.

And the 10 min moving lower all day.

Looks to me like short selling.