Monday, February 27, 2012

Update

 So far it looks like the Euro did try to kiss that pattern good bye and is starting to turn down, I'll feel better on a new low.

 The SPY, DIA , QQQ and to a lesser extent, the IWM all have this interesting candle with a long wick on heavy volume-the long wick represents higher prices being rejected and combined with heavy volume and no price gains, is often bearish churning.

 The DIA

The QQQ

The Earnings Plays

Of the 3 highest probability plays, AMKR hasn't flashed any interesting signals, I didn't see much in PCLN which I was leaning bearish on last night until I checked the 5 min chart, that is a little interesting.

HGSI which was a bullish slant has shown more then the other two, but here are PLCN and HGSI thus far today (they report after the bell).

HGSI
 Even though HGSI dipped today, the 1 min chart didn't make a lower low and has held up. That's not a major signal, but taken with the 5 min chart below, it's looking better.

 The 5 min is leading positive in to a dip today, thus far I like what I see and was leaning more toward HGSI last night, we still have time though as GOOG didn't show its cards until 15 mins. before the close.

PCLN
The 1 and 2 min charts in PCLN don't show anything, but this 5 min chart shows  weakness in to today's move in Friday's range.

I'll keep watching and let you know if anything changes.

EUR/USD (Euro)

 This is the ascending triangle (which is a bullish continuation pattern) in the Euro (EUR/USD), as you can see it has broken down. There are far fewer head fakes in currencies then equities, but until it really turns, you can't rule it out.

 It has definitely killed market momentum

 This 5 min chart of FXE (Euro) is showing some weakness that is bleeding through from the shorter charts below.

 FXE 2 min

FXE 1 min.

If this keeps up, it looks like the Euro's last run may be ending here which will put pressure on the market and probably commodities as well such as GLD/SLV and perhaps USO.

USO has had a break today, I'm not making much of it as it is just a day, but it's worth noting and keeping an eye on.

The one thing that makes this move in USO a potentially interesting one is the "channel buster" or break out of the channel on the upside, many times when this happens, although it looks bullish, it leads to a reversal. It wasn't a huge move, but it was a well defined channel. It is worth noting as I said and keeping an eye on.

As for the Euro, I'd expect it tries to maybe kiss that triangle before moving lower, however as I noted above, until it does make a break lower, a head fake can't be ruled out, although I suspect it is probably a genuine break.

Treasuries...

If you're not up to speed on the trade in treasuries, last Friday's post covered it pretty well.

We first noticed late day Treasury buying even as it was still trending down (this was interesting because this is the time of the day when the pros are most active). Sure enough it led to a reversal in the short term trend, but Friday's post shows a reversal was under way long before last week.

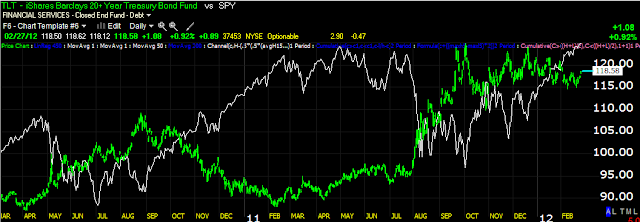
 I have pointed out the last few days that Treasuries have been rising despite the market as they have a traditional inverse relationship.

 Here are treasuries in green, the SPY in white, you can see the inverse relationship, so it is strange seeing treasuries bid even with the market. There's not much of a yield so it seems more like a flight to safety trade.

 Today TLT is up almost 1% and did not move down when the market bounced. TLT isn't exactly a high beta ETF so to see it up so much is again, strange, but it should be viewed as a hint and a piece of the puzzle.

 This is the long term 3C chart showing treasuries about to reverse and then something changed and they started seeing a long term positive divergence, almost as if Wall Street changed their mind right in the middle of what was to be a decline.

And the positive 15 min divergence I highlighted last week that has lifted TLT/Treasuries...

VXX Update

The VXX/VIX (which have an inverse relationship with the market) look like they're gearing up for the next leg up...

 There's a positive divergence on the VXX pullback from the market bounce, it looks like it's gathering steam for another push higher.

The longer term VXX chart (30 min) with a leading positive divergence at a double bottom.

Update

The German Bundestag just voted for the second Greek bailout, although I doubt this is surprising news.

The Euro's reaction thus far seems muted.
Although technically that is a bullish ascending triangle, however I would have expected more of a knee jerk reaction.

As for the averages...

 The DIA

 The IWM

 The Q's

 And the SPY...

 The NYSE TICK has recently gone very negative in the -1000 area

GLD seems to be moving lower as well.

In the near term, I think the market will follow the Euro, but the parabolic gap fill doesn't look like there was any underlying strength behind it.

PEIX Warning

PEIX is up nearly 55% for us now, be advised, although the charts look good, they report after the bell and earnings are always a wild card.

Personally I favor taking a good chunk of profits off the table, trailing a stop and definitely keeping an eye on how it is trading near the close. I would prefer to have all of my original risk money out of the stock before earnings and maybe then some. While PEIX has shown us it can run 400+%, a 55% gain is nothing to sneeze at either. We want to control as much of the trade as possible and earnings are simply one of those things we can't control, we can make best guesses, but they are the real wild card.

I'll keep an eye on PEIX as the day develops

GLD Update

 I can understand GLD rising on a little dollar weakness, it's looking like it is getting ready to turn down as it appears to be reacting more to the Euro's stall.

 The 1 min GLD chart with a positive and now negative divergence.

And the same on the 2 min.

This may not be a bad area to try that Put options trade again, like Friday's.

Quick Update

 That's one of the most parabolic moves I've seen in a while, you now how they usually end...

The market has fallen out with the Euro now that the gap is filled...

WMT's Breakaway Gap

Here's a look at WMT, it looks exceptionally weak. It also has a bearish breakaway gap pretty far away, I don't think it is likely that it gets filled.

 Here's the trend which was broken viscously.

 On an intraday basis...

 This morning WMT is not bouncing with the market, we do have 1 higher low on high volume so it may try to bounce a bit in which case it may be a stock of interest if you can short this on some strength, relatively compared to the market, it is VERY weak.

 The hourly chart and the break...

 The trend of the 1 min chart has been bearish.

This close up of this a.m. shows it to be in line, not positive, but in line which may lead to a little strength, but I highly doubt WMT will be able to fill that break away gap, making this a very bearish chart.