Monday, April 2, 2012

TICK Chart

As mentioned earlier, the NYSE TICK chart was looking like it was going to break the early morning/afternoon trend...

While it hasn't hit extreme readings of -1000 to -1250, it certainly looks to have broken the trend.

AAPL Update

I'm really watching AAPL as a barometer for a reversal and because I want to re-enter another put on it and I'm really having a hard time staying patient with AAPL at this point and am itching to pull the trigger on some puts for the MP.

Yo already saw the 30-60 min charts earlier, here are the intraday charts.

 1 min zoomed out is not in confirmation, it is leading negative, you can see Friday's positive divergence for today's bounce.

 1 min intraday is turning here.

 2 min zoomed out, with Friday's relative positive divergence (a relative divergence is weaker then a leading divergence) and a leading negative in to today as expected.

 2 min zoomed in, there's a relative negative divergence here.

 5 min zoomed out showing the negative divergence at last week's move on Mon-Tues. and the positive divergence from Friday that had me wait on a position in AAPL.

Zoomed in the 5 min is leading negative.

Although the market tends to act like a pendulum and swing much further then you expect both ways, I'm pretty much at the point I'm willing to take the risk of a little more upside if it comes as AAPL is looking juicy here. I'm going to look at the averages and ES before making a decision, but I'm leaning toward at least a partial position using Puts.

RISK Layout Update

So far, I like what I see....
 Yields which are leading more often then not, spiked Friday, this would be in line with some of the indications of late Friday that today we would see a better looking bounce as expected last week, but in to weakness. Today Yields have come undone and are negatively divergent with the market, they tend to act like a magnet for equities.

 Although the daily chart shows a severe dislocation, for our purposes of looking at the recent activity, Yields are trending down, they have been divergent at some key areas sending the market lower as it transitions from a solid uptrend to a lateral trend, I believe this is the topping process as tops are almost never "V" shaped, but rather U-shaped.  Right now there's a significant divergence between yields and the SPX in green,

 The $AUD as part of a carry trade and as an excellent leading indicator for the market clearly went negative early last week, leading the market lower and is negatively divergent today as well.

 The more recent longer term shows the $AUD going from a move in sync with the market to a downtrend in the same area the market is in lateral chop. This would also signify that the carry trades used in FX land to purchase stocks are being unwound.

 Here's the Yen, it has an inverse correlation with the market, when it moves up, the Yn carry trade becomes more expensive and is taken off, so this move may look like confirmation, it is in fact a very negative divergence.

 Also note the recent change of trend in the Yen, again, this is not good for the market, traditionally when the Yen spikes or rises, the market sells off so to se it moving up in this area where so many other indicators are confirming the same is good to see as far as confirmation in the market's activity.

 High Yield Corp. Credit I showed you yesterday as having sold off below Thursday's close late Friday, that sell-off has continued, the rule of thumb with the credit markets which are much larger then the equity markets and traded by smart money, is "Credit leads, Equity follows" so in my theory of what to expect in to a market bounce, thus far all is lining up better then I would have imagined.

Here's the longer term trend of HY Corp. Credit, note the down trend in effect and as the SPX breaks resistance, HYG is going in the opposite direction and just broke support!

Items of importance

I'm preparing a post as ES stays negative and rather lateral. I said earlier that it is too early in my opinion for the markets to move to losses or lose ground and sustain that throughout the rest of the day, but a lateral trend with a negative divergence is a much better solution. All averages are lateral now and have been since about noon time. In the meantime while I'm looking through some of the leading indicators, here are a few items of importance in the macro economic trend.

I've been following the market today and have had little time to catch up with the fundamental macro-economic situation. Several weeks what seems like months of queit on the European front, I warned that the EU problems were about to re-emerge front and center.

There are several places where this is happeneing, first the blowout in PIIGS 10 year yields we saw last week, most above 5% and heading toward 6% where debt is considered unsustainable and where each of the PIIGS that have sought bailouts did so, right at the 6% 10 year yield. So LTRO 1/2 from the ECB has run it's course, it's half life reduced and the effect now over as PIIGS yields widened in a huge way last week.

Spain is of primary concern as the ESM/EFSF bailout mechanisms running in tandem from this weekend's EU Finance Minister meeting, leaves, as Shaueble himself was quoted, $500 bn left to deal with the next emergency, hardly a firewall and likely not even close to contain problems in Spain should the current yield trajectory keep up.

Thought Greece was fixed, the bondholder swap complete? Think again. As has been noted probably 100 times on these pages, the primary problem for Greece has been the Greek law bonds that offer little in the way of bondholder protections and the UK Greek bonds that fall under UK law, which hold significantly more protections for bondholders. Hedge Funds bought up these UK law bonds at a discount looking to recover full par as they take Greece to court.

From Bloomberg:


Investors in Greek bonds issued under foreign law rejected the nation’s attempts to restructure the debt at talks last week.
In 20 out of 36 meetings, bondholders either turned down the government’s proposal, adjourned the talks or failed to achieve a quorum, according to a press release today from the Greek Public Debt Management Office.


The meetings involved holders of about $26.8 billion of foreign-law notes denominated in dollars, euros, Swiss francs and yen. Investors owning $15.3 billion of securities agreed to a restructuring, leaving $11.5 billion still to be dealt with.


Greece’s options include opening talks with holdouts to reach a mutually acceptable compromise, paying up in full or refusing to pay at all, according to London-based Costerg.
“Paying up in full would raise the issue of fairness regarding the domestic-law bondholders, while a hard default would make litigation likely,” said Costerg. “The bottom line is that this reminds investors that the Greek crisis and the euro-area crisis aren’t over.”


Last week Mark Grant gave us the TRUE debt to GDP figures for Spain which I published.


The bottom line was the official debt to GDP for Spain at 68.5% vs what a little due diligence revealed, a true number nearly double that at 133.8% and to think the gaol is to get Greece to 120% in the next 10 years or so! SPAIN IS a problem.

Mark Follows up this week with France's TRUE Debt to GDP and finds the 86.1% is way off the mark as the EU has used various accounting gimmicks, the real number... 146%! So much for the worry of contagion of the core....

Last week as the European markets came undone, I mentioned that they would bounce as they hit support... Here's the EURO Top 100 Index...

It hit support last Thursday and Friday put in a bullish reversal Harami and closed up today. This is no more then simple technical trade, it is not reflective of the fundamentals which are deteriorating badly.

Despite the bounce in Europe today, sovereign debt continued to be weak as did EU credit markets, this was an equity only rally. Spain, Italy and Portugal were the notable underperformers in European sovereign debt today, the key word being SPAIN and that being the problem in Europe that they aren't prepared to even look like they are prepared to handle.

Finally, last Monday the market was in some trouble and only saw strength after Bernie made some ambiguous "easing" comments that JPM already debunked. Last week we saw Plosser contradicting what it "seemed" Bernie was implying, although as we covered in what he said and JPM's chief financial analyst said, "accommodative policy" would still be in place with the end of Twist, so Bernie's comments were just ambiguous enough to move the market after the first week of red in the market all year, but allowed enough room for "plausible deniability".

Plosser followed up last week and threw a wet rag on the QE hopium crowd.

This week it is Fisher's turn...
As Bloomberg noted, Fisher said the 2014 pledge to keep rates low will need to be adjusted, he also said the economy is improving (the economic data would not suggest this is true, however for the purpose of the QE crowd, this was not good news from  F_E_D president. He also said, the f_E_D should take a SIT, WAIT AND WATCH' ON POLICY and that the F_E_D has DONE ENOUGH on the easing front. All contradictory to Bernie's statements, in line with Plosser and not a happy moment for those looking for QE 3.


QUICK MARKET UPDATE

 The DIA continues to be negative, but recently it has turned even more so from Friday' already negative action.


 ES/3C intraday makes very good and timely calls on divergences, this entire move in ES has been in a relative negative divergence, now it is starting to lead negative.

 The intraday IWM chart is also starting to lead negative

 The same for the Q's

 And the SPY.

This also makes sense on the NYSE TICK chart (number of NYSE advancing stocks, less the number of declining stocks). The trend in TICK is as it should look with the market, but that trend is starting to show signs of a crack below the trend line.

I'm really trying to be patient in not pulling the trigger to early. To me, just from intraday experience, it would seem too early in the day for the market to reverse and hold those losses through the close.

I'm going to look at some other indicators and charts and see if I can get a better feel for what's going on. This could certainly be an intraday pause.

Patience in AAPL

And this is why patience is key...

 Since the last AAPL update it has added about 4 points, the higher it can move, the less risk in a short position. The divergence was short on Friday, but sharp so this all makes sense.

There's a negative divergence as AAPL moves higher as well as volume and momentum falling off on  the chart above, this is what I want to see when looking to short in to strength. Now to see if we get that same effect of late day market strength after the EU close. Although I'm starting to get an itchy trigger finger here, I will remain patient.

The bounce thus far in the QQQ/IWM is encouraging as it is more along the lines of what I expected, the SPY/DIA are lagging and I meant to post this last night, I wondered if there would be some sector/market average rotation in to the the Q's and R2k as they lagged badly Friday.


GLD/SLV Update

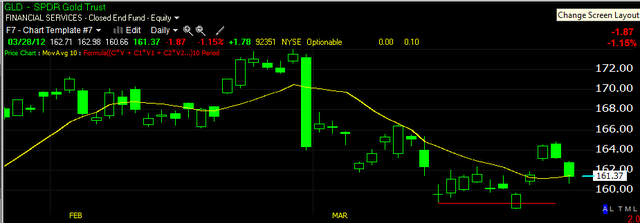
On March 22nd I posted a positive divergence in GLD and SLV as well as the miners, favoring the junior miners, GDXJ. I said at the time, it wasn't a huge positive divergence and there is still the matter of the longer term trend in GLD which is questionable, but I though we may get up to a swing length trade (up to a couple of weeks) out of GLD. GLD pulled back with the market on the 27th last week and on March 28th in this update, I posted I thought the pullback was ending and GLD would start a new leg up.

So far, so good. Here's what I was seeing on March 28th.

 The short term 5 min chart was starting to go positive on 3C.

 Typically on a new move, the first pullback is to the 10-day moving average as a general rule of thumb, on the 28th and 29th, GLD found closing support at the 10-day moving average above.

 The 15 min chart showing the first pullback since I had made the first long call in GLD, was also showing a positive divergence suggesting there was some accumulation in to the pullback, this is what I look for on pullbacks to the 10-day moving average to get a better feel as to whether support will be found there.

The hourly chart actually improved from where the initial long call was made as it remained in a leading positive position through the pullback.

Since then, GLD has moved higher along with SLV, GDX and GDXJ.

Here's what the charts are looking like now as the highs that were attained before the pullback will be the first real test of significant resistance.

 GLD 60 min, the 22nd was a head fake move below support, remember that head fake moves are the last thing we generally see about 80+% of the time before a reversal, GLD reversed after the head fake move that same day, crossing back above resistance. The idea here is a simple shakeout, the market maker or whoever, can grab the shares on the cheap as they have the total order flow book and have a good idea of which way the stock will be heading. It's an easy way for them to stock up on the cheap and add some momentum to the move. The 60 min chart looks pretty good except that 3C is at the reversal highs, which in GLD's case, is ok as price has not reached the same highs yet. Looking at GLD ALONE on this chart, I'd say it looks like it wants to consolidate again and has a decent chance of moving up to support and a pretty good chance of moving through it, but this is the longest intraday chart and takes the longest to react to changes.

 The 30 min chart is in the exact same situation.

 Here's what I don't like, the 15 min chart has been showing a negative divergence since the turnaround on the 29th, I think in my opinion, it's too early to see this kind of divergence on this long on an intraday timeframe, if GLD was at resistance from last week's highs, then maybe, but as it stands, this is something I don't like seeing and need to watch to see if there's deterioration on the next longest timeframe of the 30 min chart.

 The 2 min chart shows this negative divergence as well

 And since the accumulation on the pullback, the 1 min chart, especially today, is showing the same negative divergence. Now this could be a lateral consolidation, prepping for a run at resistance, but the fact it has reached the 15 min chart so quickly is something I don't like.

As for the miners, I'm covering GDXJ which I think looks a little better then GDX (Junior miners vs regular Miners).

 The 60 min chart here has a strong positive divergence , again note the head fake move in the yellow box. The real strength on this chart is the pullback on the 29th saw 3C much higher then the 27th's positive divergence, this is a leading positive, but once again, even though it is leading positive, 3C is stuck at the highs of last week before the pullback. All in all, again, looking at this chart ALONE, I like what I see and there may very well be a bigger accumulation cycle forming in GDXJ and perhaps the PMs as well.

 The 30 min chart looks a lot like GLD's in that it is leading positive, but stuck at the highs of last week, again GDXJ's longer term 30-60 min charts look even better then GLD's.

 The 15 min chart here is less troublesome, it is leading positive through last week's highs, so this needs to be watched to see if the 30 min chart sees this strength bleed in to the 30 min.

 The 2 min chart looks better then GLD's as it showed confirmation at the green arrow (3C moving higher with price), but again today there's a negative divergence. GDXJ is up over 2% and approaching the resistance area. This is what I think the GLD chart should look like, this makes sense.

 The 1 min action today intraday has been negative, again this suggests that GDXJ may want to pause and consolidate, laterally which is through time or pullback which is obviously through price, either will work (an example of a lateral consolidation would be a rectangle or triangle).

 SLV's 60 min doesn't look as solid as GLD/GDX, but it did put in the same positive divergence at the shakeout, the problem here is SLV HAS hit resistance from last week's highs and there's a negative divergence. Again, this is a 30 min chart and slower to react so it may yet still move in to a position of confirmation as 3C hasn't turned down yet today.

 The 30 min chart shows SLV just above resistance and seeing a negative divergence, 3C to confirm should be at the same level as the red trendline.

 The same problem on the 15 min, although it too has yet to turn down so it may still confirm.

The 1 min chart looks as I would suspect for just hitting resistance, I would think a consolidation would be in order, whether that happens or not, it's hard to say and it could happen above resistance or below resistance.

So there's a bit of a dichotomy as the longer term charts for the most part look pretty good whereas the short to mid term charts don't look as good. GDXJ looks the best as of now.

I'm not seeing enough evidence to suggest these can't move higher, I am seeing some trouble that I don't think should be showing up this early, but SLV reaching resistance may be putting pressure on GLD/GDXJ.

They need to be monitored at this crucial juncture.

One reason I think we are seeing resistance other then the fact there is resistance in the area is the inverse correlation with the dollar.

Here's the dollar intraday.

It fell through the morning lending support to almost all risk assets from stocks to the precious metals, but recently put in a tweezer bottom. Since this capture, the dollar has moved sideways and that is going to put pressure on the commodities incl. the PM's.

I do like the longer term chart's improvement in most cases, it will be a matter of seeing whether it holds .

I think for the moment, the PMs are in an area they may be forced to consolidate.

AAPL Update

As mentioned late on Friday, I decided not to enter AAPL after it saw an 11 point drop and was showing signs of a positive short term divergence in this AAPL Update.


AAPL closed the week with its biggest 2 day drop since November, a shakeout to the upside certainly seemed logical, whereas the dogma of technical analysis would tell you to be all over a short position on a move like that, as I mentioned in the update above, I'd prefer to wait for a better set up and we are seeing that unfolding today.

This was the AAPL 5 min positive divergence posted on Friday, still intraday timeframes and a rather short divergence which would fit with a shakeout move.

To the left is the action from earlier in the week.

As for AAPL today and the longer term....

 There have been warning signals before this leading negative divergence in AAPL on a 60 min chart, I have been warning that something appears to be changing for AAPL, I'll address that on another chart. At last week's Monday/Tuesday highs, AAPL was already in a leading negative position, I don't think it is coincidence that it put in the largest 2 day drop in 4 months this week.


 The 30 min chart shows the same leading negative divergence and perhaps more importantly as far as timing goes, it is in a flat area, almost a H&S type formation. Negative divergences are often seen in flat-ish areas of trade, again I suspect it has something to do with institutional orders being filled near the VWAP.

 Again, the 5 min chart from last week's highs to the lows and the divergence that made me decide to be patient and wait for a better set up in AAPL (short strength, not oversold weakness-although looking at a longer term chart of AAPL, oversold only applies to intraday trends, certainly not to the daily/weekly). At this point, I view AAPL as a short, it's just a matter of the tactical entry, being able to get the best position with the least risk and highest probabilities. If I were a long term investor, a few points here or there probably wouldn't bother me and I'd likely just short AAPL right here and put it away for a while.

 This a.m.'s action on the 2 min chart is showing non-confirmation.

 The 1 min chart is worse, it went negative right at the highs. If it were later in the day and the Q's had moved up decently, I'd probably be looking to short AAPL here, but as it is early and there's still that European closing trend of recent, I will be patient with AAPL.

 Look at the weekly chart, I think I may have posted this (I send a lot of charts via email so sometimes it's hard to remember where I posted what), but the VERY parabolic move that actually started since 2009 has become EXTREME since the start of 2012, everyone knows how I feel about parabolic moves either up or down, they tend to end badly and we have seen the evidence of this on numerous occasions, but this being a weekly chart, it carries special importance toward the longer term trend in AAPL. I want to show you MSFT when it was behaving in similar fashion...

 MSFT weekly chart back in 2000, it also went parabolic and got very volatile toward the end. MSFT declared a dividend after the Tech Bubble popped and MSFT has never seen this kind of growth again, this is what I was talking about earlier, perhaps the trouble seen in AAPL starting several months back might have been dividend related, certainly I think there's a Steve Jobs influence there too, but the point being, these two tech giants look very similar between MSFT in the 90's and AAPL now.

 Since 2012, this 10 day moving average has moved up, it is now moving laterally, something few AAPL longs probably notice as they are more focussed on AAPL new high headlines.

And on a 15 min chart, you can see what does look a lot like a H&S top forming. There are very few "V" shaped reversals, this is a huge market cap stock and they don't usually turn on a dime as institutions have to move positions and huge amounts of shares around. However, the danger as pointed out in the breadth post is the day when it unambiguously cracks. If we saw the biggest 2 day drop in 4 months off some lateral action, when the ice breaks it could be a whole lot worse in a single day and thus we have a term for that, "Bull trap". I can't think of a better stock to set one up in.

Again, for now, I'll be patient with AAPL and se if I can't find a better entry.