Tuesday, April 10, 2012

GDX Chart Request

There is still the issue of GLD and its longer term trend. I haven't taken a close look at GLD for a while, but I need to do that as GLD was looking very much like it was hitting either an intermediate or primary top. Things in gold will be unpredictable in the near term as it may act as a flight to safety trade which it has before, but that would also suggest it may be moving against it's legacy arbitrage correlation.

In any case, GDX was the request...

When doing some back testing for the Miners Trading system (which I need to back test and maybe throw that back in the line up, I found two primary drivers of miners, one was currencies and the other energy. Assuming a miner's costs are fixed in that they know what the land lease or purchase will cost, the machinery, etc, the two wild cards are energy prices as mining is energy intensive and currencies. Gold is sold across the world in $USD so if the $USD vs the miner's local currency (depending on the country) sees a shift in the currency pair, the miners still can only sell gold at $USD prices, but they can be in a position in which the local currency costs them more in labor and the conversion between the $USD and the local currency may not be favorable. Just think about when you travel abroad, a strong dollar versus the local currency will buy you more in the local currency, a weak dollar will cost you more. It's sort of similar as their sale prices for gold are fixed at the $USD rate, but vs the country they are operating in, shifts in currency can severely effect not only what they make once the $USD is repatriated in to the local currency, but can also cause labor costs to rise relative to their profit potential, depending on what the $USD is worth compared to the local currency. Energy prices too are a wild card, although I would think larger mines hedge energy costs like airlines do. In any case, those two issues seem to be the wild cards that can help determine whether miners do well or poorly.


 Long term the daily MoneyStream chart of GDX doesn't look good.

 Near term GDX broke a significant support level so we have the volatility shakeout concept.

 This is the 30 min chart with a positive divergence here.

 The 15 min chart also has a current positive divergence, I also marked a head fake move at the yellow arrow, a slight breakout move before the downside reversal just as a tool for you. That particular run was showing distribution throughout the move up and was bound to fail.


 The 5 min chart also shows a positive divergence, actually leading positive which is stronger and in a relative flat area where divergences occur most often.


 The 2 min chart was positive from late last week and GDX has moved up a bit, but still within the range. This leading positive looks like GDX will break out above the range of the last 3 days.

 There's a positive divergence yesterday on the 1 min chart and GDX moved up from there. Thus far the move is showing confirmation.

I would think GDX could see a quick move up and probably somewhat volatile/strong. I would consider a position in GDX here (long), but I would also have tight risk management on the trade with a stop below the recent range around the $45.90 area.

The hourly trend channel has held swing moves, I believe this would be more along the lines of a swing move and the stop there is at $46.19, which is close to my $45.90 stop mentioned. If GDX moves through the range, I would look to tighten that stop to a 30 min chart ASAP.

Here the 60 min TC holds the up swing and the down swing.

If you need a different stop, just email me.

AAPL Puts explanation

I was reminded by an email asking about the BIDU/AAPL puts.

I closed the AAPL April 635 Puts precisely because they were April and they were at a small profit. The BIDU I left alone because they are already May expiration, I want to move the AAPL Puts out to May expiration and will look to do so on price strength.


11%, not what I hoped for, but you have to take what the market gives.

Closing AAPL Puts

Explanation coming

Market Update

 As suspected, the 1 min divergence is getting stronger in this lateral area, ALWAYS after the EU close.

 The 2 min is starting to lead positive which is the first time today

 On a 60 min chart the top formation is much easier to see than a 1 day chart, so is the break. This is an important break. It has been our experience market wide that any break of important support almost always sees a strong volatility shakeout move. Technical traders will be expecting a test of former support, now resistance at the trendline. However our experience has been that rarely happens and the test will look like it failed as the market moves above resistance, this would keep the "Buy the dip" longs in the game as most people are pre-dispositioned to being long the market. With volatility increasing it would not surprise me to see a move above the trendline, it may take more then a day, but it wouldn't surprise me.

Think about the psychology of this, bulls feel like the top broke and the break was a failure, they feel safe to buy. The shorts ask themselves, "Why won't this market hold its losses? This must be a correction and not a top". This is exactly what Wall Street wants, to keep everyone guessing, to keep everyone moving in to trades as most traders chase the market and then see those same trades stopped out. This is all to Wall Street's advantage. So while I can't point to a strong enough positive divergence as of yet that would suggest such a move, that has been my experience. I have little doubt whatsoever we are witnessing a top breaking apart, however for the market to do what I mentioned above, volatility must increase. Over a week ago I said, "Watch out for increasing volatility".

This is why I let go of the AMZN Puts and took the profit, I haven't even looked at AMZN, I just made a quick choice based on the market as most stocks will move with the market. If what I laid out above happens, then I'll have the profit from the AMZN trade closed out and another shot to re-open the trade on any price strength.

Should the market fail at resistance, then this market is in much worse shape then even I think and I think it's in VERY bad shape. In that case, there will be plenty of downside and I won't have missed much.

Here's the SPY intraday moving laterally as expected because "V" reversals just aren't common. One potential trigger to look for is a break below support of this lateral consolidation, I say this because it would be a head fake move and we almost always see a head fake move before a reversal. The purpose is to draw shorts back in thinking another leg down is starting, then prices move back up and start their bounce forcing shorts to cover the new positions which adds demand and gives the bounce that extra kick.

Closing AMZN PUTS

I was going to hold these, but I'll take the 20% gain and explain why in the next post...

Market Update

The last week or two I've been saying "Expect volatility to get worse". I'll have to check where we are at with volatility now, but as mentioned earlier, pre-NFP last Friday it was 50% higher than Feb.

 The earlier SPY positive divergence looks like it was run over and that can happen, but it looks to me that there's been some short term accumulation in to lower prices as the relative positive divergence is holding well. For short term confirmation 3C should be lower than it is where the arrow starts at the left. "V" shaped reversals aren't seen often and I would think we are likely to see some chopping around laterally for a bit in the area, it seems to have already started.

 One of the reasons 3C is so difficult to understand compared to other indicators is because it is showing underlying smart money action. Although we have some short term positive divergences, the damage or the extent of distribution accrues from shorter term charts and a series of moves in those short term charts. For example, a positive divergence in the SPY may lift it like it did the last two weeks and the last bounce the SPX made a new high, but the accumulation period was small compared to the distribution once price started up, a series of moves like that adds a little accumulation to move price intraday or for a couple of day bounce, but the distribution is much heavier and accrues on the longer term charts. When we had the last real bounce (early last week), I said that bounce, even though it made a new high in the SPX, was starting from a much weaker place and distribution in to the bounce would be heavy. You saw the 15 min chart earlier and how deep the leading negative divergence was, look how much additional damage has been added today alone.

ES timeframes are a bit different on 3C then stocks, but here's the 1 min, a similar relative positive divergence suggesting the market is accumulating enough to simply get the market to bounce, which will see distribution in to the bounce.
The 4 hour chart of ES shows how bad the situation is. 3C is now lower then it was at the October lows when the market started to rally, yet price is much higher.

How can that be explained? Weighting of the averages, such as stocks like AAPL and market breadth.

Here's a simple example of market breadth showing the deterioration in to rising prices. You have to remember, Institutional positions are huge, they can't be flipped in a day or a week, it takes time to turn a ship that large and reverse course.

While the averages alone and any indicators applied to them may have looked bullish, this simple breadth chart shows what was really going on with all of the components that make up the average, this takes away the deception of weighting.
In green is the percentage of stocks trading 1 standard deviation above their 40 day moving average (red is the SPX). In February the percentage of stocks was almost 80%, by the time the SPX made it's highest high last week that percentage was cut in half and now stands at 12%. That means, despite what the weighted averages say, more components in the market are falling apart faster then most people realized, price of the average alone can't tell you this and thus, price is deceiving. I've been warning about this market for a long time, it IS NOT what it appears or appeared and we are just starting to see that now.

However, Wall Street will try to keep as many people guessing as long as possible and that is why volatility will continue to increase until there is a break that is simply unrecoverable. 3C has been showing it, the risk layout indicators, credit, etc have been showing it and breadth has been showing it.

European Markets are now closed

This candle with the long lower wick and high volume is a very typical sign of an intraday reversal. The market has lost a lot of ground very early in the day and usually has trouble holding losses this big this early, so this should be the area where the market reverses on the intraday volatility run. Should this not hold up, several recent trends will be broken, that of the afternoon rally after the EU markets close, that of high volume on a slightly bullish candle acting as a bottom intraday, the concept of early losses not being held by the market as it takes some back. Should that happen, we've crossed over.

Risk Layout Update

We are going to look at intraday and the longer term as we are rapidly approaching what I believe will be a major break in the markets, the evidence has been piling up for quite some time. This is a very fast moving market so I'm sure some of the intraday charts will change before this is even published, but I've tried to stick with charts that stand out and are a little less ambiguous. Have you noticed that even my short term trades have all been on the short side?

Starting with commodities.

 Thus far intraday commodities are performing a little better then equities, this is why...

The $USD hasn't made a higher high thus far since the 10:15 area and commodities have a stronger inverse correlation to the $USD then do stocks.

 For the perma-Bulls who thought this lateral area was their long lost consolidation, there have been many indications if you look in the right spot that it is not a consolidation. Take commodity performance during this area (SPX is always green).

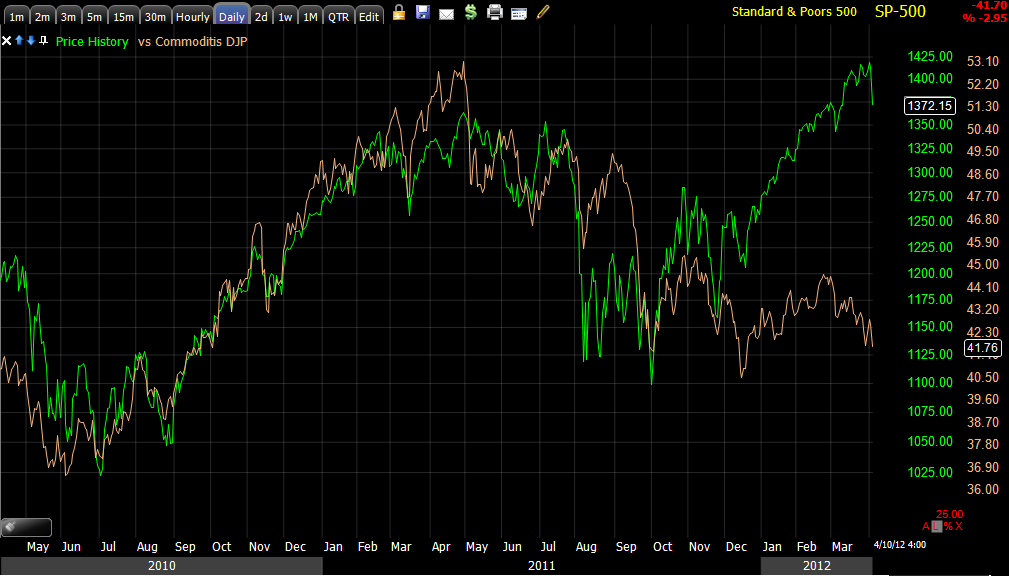
 Why I have had a sour taste about this rally, look at the long term performance of commodities vs the SPX, China as a global growth engine is sputtering.

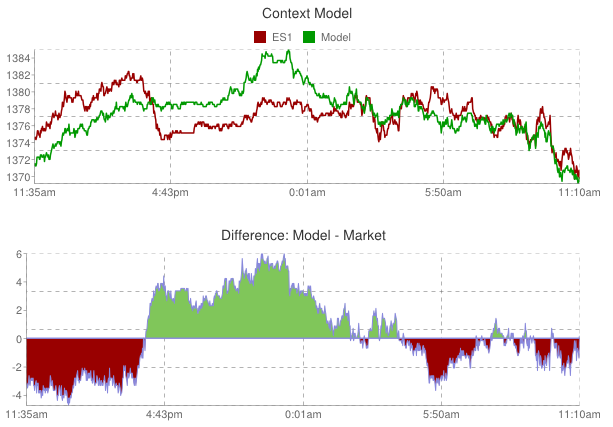
 As for  CONTEXT, it is roughly in line with ES. This is an important point because when we see divergences on these charts, they almost always revert to the mean as ES has reverted to the CONTEXT model after seeing one of the largest divergences last week that I have ever seen between the two. Translation, underlying fundamentals are falling apart fast.

 Remember how many divergences we have seen with the SPX up and Yields divergently down? Today the market has reverted to the short term mean. Now consider the longer term and the concept of reverting to the mean...

 I refer to yields as a magnet for stock prices, Yields clearly signaled this WAS NOT a consolidation taking place even as the SPX made new rally highs on the last bounce-"PRICE IS DECEIVING"

 REVERSION TO THE MEAN? The last divergence in Yields vs the SPX to the left reverted to the mean. Getting the picture here? It isn't pretty.

 UUP / $USD intraday as noted was supportive of a move up in the market yesterday early in the day, today it has been putting pressure on the market, but may have found some resistance as we OFTEN see right after the EU markets close.

$AUD is not giving a bullish signal, but it is allowing a little breathing room for the market here.

 Again as to the question of consolidation or top, the $AUD's trend is yet another indication of what the story is despite all of the volatility, recent new highs and now recent new lows. Remember, reversion to the mean.

 As I suspected last week, Credit wasn't buying the rally, it was selling it and I expected a new low to be made in credit, here it is (yesterday as well).

"Credit leads, stocks follow", so this is a consolidation or more likely a....

AMZN Update

AMZN looks like it is starting to find some intraday accumulation on the 1 min chart. The Puts in the options model portfolio are for May so I think I'll leave those in place.

 AMZN 1 min positive. The SPY positive divergence is holding up, so I'd expect an intraday bounce, probably shortly after Europe closes. The DIA has a decent positive divergence on intraday charts as well, the Q's and the IWM are both in relative positive divergences, Q's being stronger than the IWM at this point.

AMZN was always suspected to be a head fake trade, even before it actually broke above resistance, we expected the move. After the break through resistance (sucking longs in), we saw a confirmed candlestick reversal and 3C distribution throughout the breakout, confirming the head fake nature of the move. Since AMZN has broken back below the breakout point. Since AMZN is further along in the head fake move (already confirmed), it is in a very dangerous spot as the head fake move is one of the last things seen before a reversal to the downside (in this case). Thus I'll keep the puts in place.

SPY Divergence NOW

As mentioned, the market is moving exceptionally fast, this is part of what to expect as the market is trying to shakeout traders in every direction and keep everyone guessing.

Since the last post the SPY 1 min divergence is now leading positive, this is how fast the market is moving, I haven't seen it move this fast since last year, ironically around July.

There is one consistent theme in the underlying trade, that is any price strength seems to be sold in to, that can be straight selling or short selling. You can see that trend here...

All of the selling in to strength is gaining 3C downside momentum, watch how the red arrows from left to right each get deeper and now we have an accruement of distribution on this 15 min chart which is hitting new leading lows that are lower then any point this year and well in to last year.

Getting rid of some of the noise from the volatility, you can see the trend changing.
Watching a 10-day moving average of the SPX, you can see how it easily held the uptrend and NEVER went more then briefly lateral, prices have moved below the average and more importantly is the direction of the average itself, down.

Later I'll try to show you how the market is trying to keep things confusing with intraday trade and short bounces, but the underlying trade on the 15 min chart is pretty clear as to what is happening. In the meantime, you can either be nimble and take decent profits quickly or you can build a position and ride out the volatility. I prefer to try to stay nimble here as the signals are pretty clean, but at the same time I'm maintaining some longer term exposure. Like I said yesterday, you never know exactly when that crack comes.