Wednesday, April 25, 2012

Market Update-AAPL action

So far, pretty consistent and what we have seen in past bounces now that we finally have the bounce.

I will be entering the partial position in AAPL that I intended to, an equity short, not options as this is part of the longer term position I have been putting together. I will put up AAPL analysis next, this has nothing to do with AAPL analysis and everything to do with correcting my original intensions (I suppose the 60 min chart has something to do with AAPL analysis). You may want to see the AAPL update before taking any action.

 The DIA 1min from yesterday's late positive divergence mentioned to the open, there's a bit of a leading negative component, deeper than the DIA pullback off early highs.

 The 2 min chart from yesterday's short term accumulation, this is a relative negative divergence on the open, in other words it seems there is some selling in to strength here.

 The 5 min chart didn't have enough steam to even confirm the opening gap up, this is a failure to confirm and is bearish. This is also what we saw in the last 3 real market bounces as this one has been much more volatile and choppy.

 ES is doing what ES did the last 3 bounces in the market, it's moving in a persistent negative divergence, rarely seen except for the last 3 bounces.

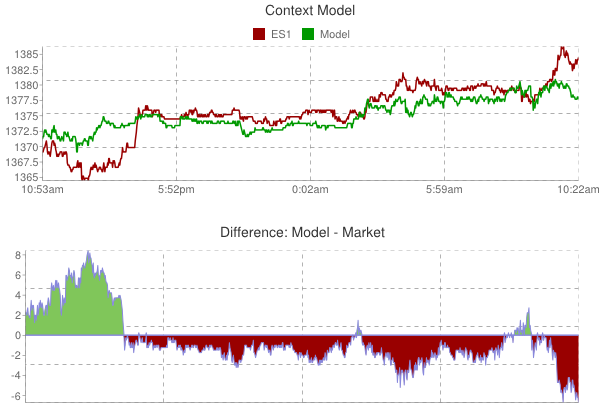
 Yesterday the conditions in the market that make up the ES CONTEXT model were favorable for more ES upside, as we saw that ES upside, the conditions are now about in sync with ES's price and the model is starting to deteriorate. There was room for more upside, but not much more than what we hve seen, the model is now lower than ES.

 The IWM is the one average I thought would be the least important as to shaking out shorts because it had the least defined resistance target levels and as such was the least important to me. The 1 min chart is leading negative here with a failure to confirm the gap up, again, this is what we saw in the last 3 bounces, failure to confirm strength.

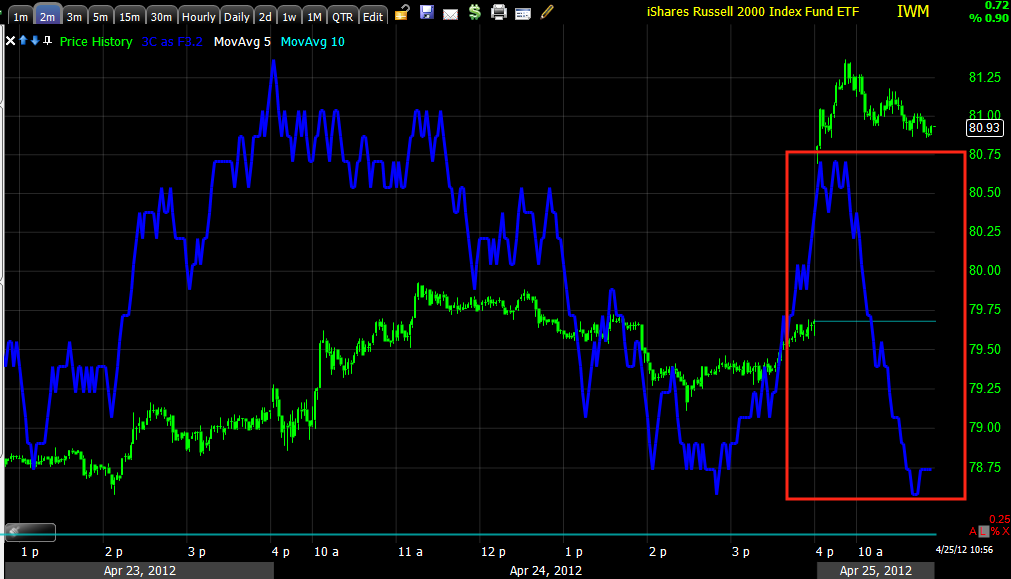
 The 2 min chart looks a lot like the Q's, a quick spike and then a leading negative divergence

 The 5 min chart never confirmed the upside gap. $81.50 in the IWM is the closest thing to a shakeout level.

 QQQ late day 1 min positive divergence, total failure to confirm. The Q's would be expected to benefit the most from AAPL as it holds immense weight in the NDX as they have (compare to the Dow gains), the failure to confirm and leading negative divergence seem to indicate that all strength-at least on the open, is being sold in to.

 Like the 2 min IWM chart, the Q's show the exact same.

 The 5 min chart had a bigger positive divergence, it is simply in line for the time being.

 Similar to the DIA 1 min, the SPY is seeing a slight leading negative divergence on the 1 min

 The 2 min failed to confirm by making a new high with price relative to this chart's history.

The 5 min failed to confirm as well, leaving a strong relative negative divergence.

Thus far everything is on track. We expected to see negative divergences in to strength and there they are.

AAPL up next.

Dumping My AAPL Call and Fat Finger Trade

 As AAPL has broken though all 3 targets I set for this move, it's time for me to do some house cleaning.

This Call which was meant for a short term move in AAPL that didn't materialize until today is being sold as we have hit the target zone and I got lucky, although the last move in the market was always expected to be AAPL, good thing I went with the May expiration as opposed to the April. There is a method to the madness.


This is the Fat Finger trade in which AAPL was intended to be shorted at this level, instead I bought it, time to move out, but hopefully I will remember to post later why trades and motivations exactly like mine in this situation are what crate support and resistance.

Initial market update is coming up.


AAPL and thus the market have survived the overnight session

I had so many alerts pop off on this move, it took 10 minutes for them to stop! As Peter Tchir of Market Advisors said, "I can’t really remember many days where a single company’s earnings could move the entire global market in all risk assets "

Lets start with the UK, overnight GDP was not good and the UK has entered a double dip recession with a GDP print of  -.2% (consensus of +.1).  For historical perspective, this hasn't happened since the 1970's. The trend is emerging in Europe as the UK joins Spain and Italy in their second recession. Recession is defined as 2 consecutive quarters of negative GDP growth. Since 2Q/2008, the UK has contracted 9 quarters. This is not transitory, this is a trend and trends tend to continue, "Thus the Trend is your friend".

In this latest series of UK GDP, there is a spotlight on weak construction, or weak housing, another globally accelerating trend (keep an eye on Australia and continuing problems in housing in China).

The French elections are starting to show, whoever win (except Sarkozy-which is looking more unlikely), the political consensus from across the spectrum in France is to move away from the German model of the EU, this is why Sarkozy's defeat will re-shape everything that has been done in the EU to date and Germany will stand with few allies, having lost France. A new consensus will emerge as all EU countries, especially the PIIGS and now France begin to realize that the EU free trade zone was never much more than a conduit for German exports. This realization will have far reaching effects on what the EU looks like moving forward, if it does in fact continue in its existence as nationalism and protectionism rise in individual countries, moving away from integration and toward disintegration of the EU model.

The recent flight to safety in EU sovereign bond land has been to German bonds, that is why the overnight failure of the German 30 year bond auction is surprising. It wasn't a complete failure, it simply didn't raise the target amount of 3 bn, instead 2.40 bn with the German Bund-bank holding the rest. Some ascribe the failure to the overnight risk on move in the markets initiated by AAPL, this is why I say, "AAPL is the market". However I have a different theory, with the EU's fate looking very different then 3 months ago, German exports would have the most to lose in an EU disintegration or any significant changes toward nationalism/protectionism. The 30 year may have just been too far out with uncertainty lying directly in front of us. To wit, the EU market has performed well today. Bad news is good news? AAPL? Or simply an oversold bounce? We will see what the European internals look like in a few hours after the close.

Today is al about the F_O_M_C policy and subsequent Bernakacide press conference. Market consensus is for there to be little change, perhaps slightly more dovish with a lot of talk about "Vigilantly watching and being prepared with the tools necessary should they be needed"or put another way, the F_E_D basically in "wait and see mode". This alone, as mentioned last night (no change) could be a huge negative and taken as a hawkish stance from the F_E_D, but any slight changes that sound a bit more dovish should see the market chose to initially interpret them as QE positive. I often say that, "the market will give you a thousand reasons to justify any stance you want to believe in" and the market WANTS to believe in more stimulus, it is what happens after that will really matter-thus the KNEE-JERK REACTION.  I wonder what the F_E_D said about Bear and Lehman initially, if they were simply, "Transitory" events? Believe me, I'm no fan of the manipulation of market fair values by hitting the CNTL-P key at the reserve, my point simply being is the F_E_D since the start of the crisis in 2007 has been several steps behind and deployments of capital have been ineffective, only building the debt pile, not creating a sustainable fix. It's simple, if you are in personal debt, sometimes the only way to pay your bills is to incur more debt, but it is not a solution, it is survival and hope of a future "Hail Marry" that things will change before the debt collectors come knocking.


As recent as yesterday I made a prediction, "more sovereign downgrades", but I was referring to the EU and Holland in particular, surprisingly or at least off my radar screen, the S&P ratings agency is looking at downgrading, ready? India. This may seem irrelevant as India has not been covered much here, that will change. Why significant? India is the "I" in the "BRICS" emerging economies, the supposed saviors of the world economy.

This morning the trend of bad US economic releases continued with Durable Goods

Released On 4/25/2012 8:30:00 AM For Mar, 2012
PriorConsensusConsensus RangeActual
New Orders - M/M change2.2 %-1.5 %-3.5 % to 0.6 %-4.2 %
Ex-transportation - M/M1.6 %0.4 %0.0 % to 2.4 %-1.1 %


This is a stunningly large miss. This is the largest miss since Jan. 2009!

This single report on the day of the F_O_M_C meeting is exactly what the market needs to justify and jot or tittle in the policy statement as being dovish. For the QE hopefuls, back economic data is good news. This also clearly indicates that the economic recovery that was brought on in the early months of 2012 with seasonal adjustments now appears to be as bunk as the arbitrary seasonal adjustments themselves. However, even with that, it was not enough to knock ES down in pre-market as AAPL rules until the policy statement.

I took the time to write this as this is an important series of fundamental data releases, we will cover the macro theme in greater detail, but for now, AAPL reigns for a few more hours. It's time to start looking for tactical moves and be ready for any possible strategic changes from the F_E_D.




Now it's up to Europe

It's looking like we'll hit our targets, at least AAPL got us in the area, now it needs to stick overnight.

 This is AAPL afterhours and at their earnings, note the upside momentum waned about the time of the conference call seen at the bottom of the chart, that's when guidance would have been given and guidance was on the low side.

 ES so far saw the AAPL boost, but since has been lateral, that's why the EU open will be the next event to influence ES, which in turn will influence where pre-market trade opens tomorrow morning.

The reason ES is rather flat is because since the close, the EUR/USD hasn't done much, again, Europe is crucial to the US open.

After that, come the afternoon it will all be about the F_O_M_C statement. There's 1 time I remember we caught a 3C signal before the policy statement, a clear leak of the policy statement, but only once as media outlets have the policy statement before it is announced, just embargoed so they can speak intelligently (as far as that is possible) about the statement. In other words, some unscrupulous errand boy could make copies of the embargoed policy statement and make a quick call to a buddy on Wall Street and probably get a Ferrari in return for the early info. We'll watch for signs of that, but so far only once.

As to the policy statement, it's anyone's guess and it could be and probably will be a definitive market mover, even if they change nothing from the last statement. One thing to be aware of is the F_E_D effect, there's ALWAYS an initial knee jerk reaction, it can last 15 minutes or a couple of days and then the market seems to either reavaluate what was said and the market changes direction or more likely, they need sometime to set up their positions and the knee jerk reaction is what helps the do that. Just be aware that first reactions are not usually the final reaction whenever it comes to the F_E_D.

Lets keep our fingers crossed that our plan goes according to plan, the market moves higher on a fast volatile move, we see excellent 3C divergences and short strength, that's been the plan since April 10th and hasn't changed.

There really isn't much more to say, it's now just a waiting game and perhaps an adjustment game.

At the time of the policy statement it's unlikely my reaction time to emails will be very good, I'll be watching for any hints in the market so if it is absolutely urgent, put "URGENT" in the subject line and just be ready for and expect a wild initial knee jerk reaction, but realize that it is not in concrete unless some very unlikely thing are said.

While these are very exciting market moments, they are my least favorite as they are the biggest wild card in which we have little edge because Wall Street has little edge. If things go the way they are supposed to, we all find out at the same time. However, as I mentioned, we did catch one leak and reacted to it before the statement was issued for a nice trade.


Tuesday, April 24, 2012

AAPL AH Update

I had several resistance zones marked, looking for a move in AAPL, $575 was an important support zone that had been broken, $600 was another as a centennial mark, which is psychologically important. The final area would be above the downtrend resistance just over $600, AAPL is now trading at $602.40, should this hold up overnight (the guidance may be an issue, if not now, probably soon), AAPL will have accomplished the volatility shakeout of numerous shorts we have been looking for.

As AAPL has the power to move the market, the level I'd like to see in the SPX would be in the $1400-$1410 area, currently the SPY is around $138 or $1380 SPX.

Oh... Earnings may explain these two charts of AAPL

 The more important AAPL 60 min has been in an ever worsening leading negative divergence, this is one of the fastest, ugliest 60 min leading negatives I've seen in a long time.

The shorter term 15 min which is leading positive represents the near term, typically swing trade length. The 60 min in the condition it is in, represents a reversal of AAPL's trend.

This may make some sense upon first look at earnings (try to recall the earlier post about earnings/guidance/sentiment).

AAPL beats on revenue and EPS, pretty solid.

  • APPLE 2Q REV. $39.19B, EST. $36.87B
  • APPLE 2Q EPS $12.30, EST. $10.02
  • APPLE SOLD 35.1 MILLION IPHONES IN QTR, EST. 31.2M   
  • APPLE 2Q IPOD UNITS SOLD 7.7MLN , DOWN 15%            
  • APPLE 2Q IPAD UNITS SOLD 11.8MLN                      
  • APPLE 2Q GROSS MARGIN 47.4%, EST. 42.8%              
  • APPLE 2Q MACINTOSH UNITS SOLD 4MLN , UP 7%            
AAPL Guides lower.... 
  • APPLE SEES 3Q REV. ABOUT $34B, EST. $37.49B
  • APPLE SEES 3Q EPS ABOUT $8.68, EST. $9.96    
AAPL is well known for conservative guidance, this however may be the perception that changes not only AAPL, but the market.


There she blows

 While I haven't read the AAPL earnings, there's the bid/ask above $580 after earnings were released for AAPL-maybe we get our tech rotation after all-Finally.


 ES pops at 4:30

It seems the chart with the least noise (other than the 60 min chart which is as you know, very ugly) was the correct chart.

All of the averages are up in after hours, the Dow optically looks to be the laggard.

More coming...

ES Update

Something interesting happened right at 2:30 in ES, if you didn't already know that AAPL had broken below yesterday's support and then crossed back above it at 2:30, this may night be as interesting. It seems the market has all of its near term hope pinned on AAPL.

 While 3C still remains locked in a negative divergence (as explained earlier, the only time 3C on ES shows persistent divergences is during bounce attempts that have failed, otherwise it is an excellent intraday movement indicator), ES found a bottom right at 2:30 as AAPL crossed back above yesterday's support.


 ES had a brief struggle at VWAP (this is where institutional orders are targeted for execution). Since the close, ES has gained even more ground.

While we haven't looked at our own version of CONTEXT, the risk asset layout, as mentioned earlier today the underlying credit, rates and fx components that make up the model have been supportive of ES moving higher, as the histogram shows, that has increased throughout the day.

I'll be looking at our own, more detailed risk asset layout shortly.


Energy and GDX/GDXJ

No charts for the gold miners, my position is still open, they are showing end of day positive leading divergences that look great.

For Energy
 1 min largely in line, financials look worse, this could certainly be the Euro repatriation effect as energy has a strong correlation to the $USD (Euro is just a proxy).

 One of the best head fakes in the last week in yellow, this is the morning I sold my USO calls right at the top. 2 min is in line, financials look worse as far as relative performance/rotation moving forward.

 That beautiful head fake move, note it made a higher high and failed spectacularly, this is why I love the head fake trades.
 5 min showing some weakness -not in line currently

15 min Energy, again, beautiful head fake move, good money to be made on those. 15 min is in line, not nearly as strong as tech.

Financials

About that rotation...


 XLF 1 min leading negative

 2 min leading negative and note the flat area, this is where divergences are most commonly seen, the reason is simple, filling institutional orders at the VWAP.

 The 5 min leading negative

At this point, I would consider shorting financials here and now, the only problem is that the market tends to move together. This would suggest if Tech can take the market higher, financials will move in the same direction, it is just their relative performance that would lag.

The all important 15 min is only in line. Again, this is not very positive for financials, but I would not be taking large bets against a directional move, even if it is a relative weak performer.