So far, pretty consistent and what we have seen in past bounces now that we finally have the bounce.
I will be entering the partial position in AAPL that I intended to, an equity short, not options as this is part of the longer term position I have been putting together. I will put up AAPL analysis next, this has nothing to do with AAPL analysis and everything to do with correcting my original intensions (I suppose the 60 min chart has something to do with AAPL analysis). You may want to see the AAPL update before taking any action.
The DIA 1min from yesterday's late positive divergence mentioned to the open, there's a bit of a leading negative component, deeper than the DIA pullback off early highs.
The 2 min chart from yesterday's short term accumulation, this is a relative negative divergence on the open, in other words it seems there is some selling in to strength here.
The 5 min chart didn't have enough steam to even confirm the opening gap up, this is a failure to confirm and is bearish. This is also what we saw in the last 3 real market bounces as this one has been much more volatile and choppy.
ES is doing what ES did the last 3 bounces in the market, it's moving in a persistent negative divergence, rarely seen except for the last 3 bounces.
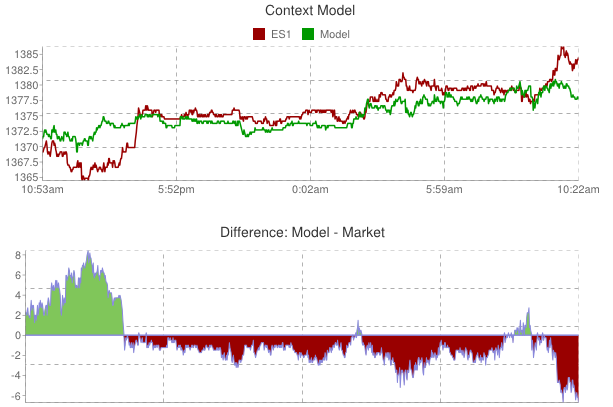
Yesterday the conditions in the market that make up the ES CONTEXT model were favorable for more ES upside, as we saw that ES upside, the conditions are now about in sync with ES's price and the model is starting to deteriorate. There was room for more upside, but not much more than what we hve seen, the model is now lower than ES.
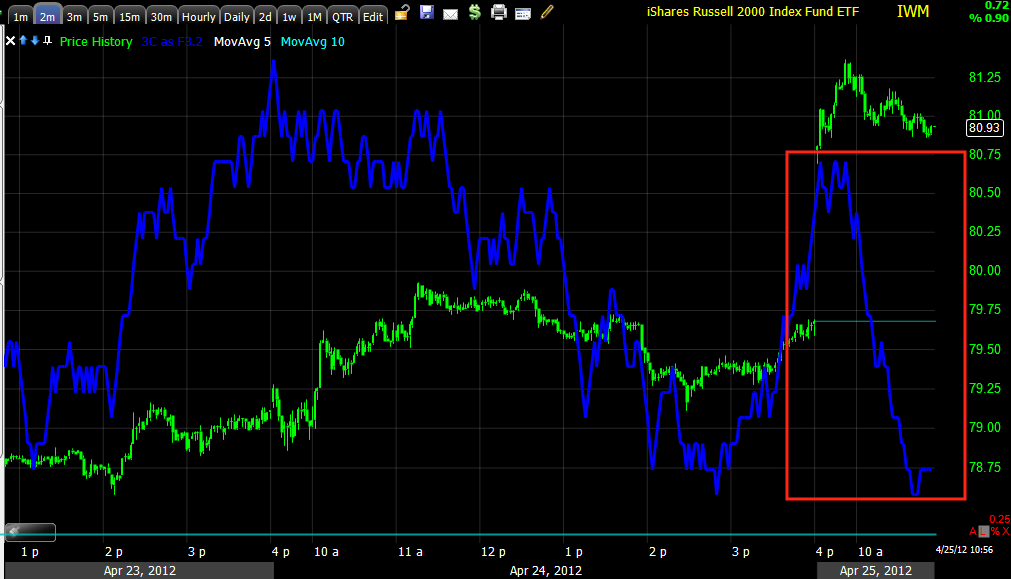
The IWM is the one average I thought would be the least important as to shaking out shorts because it had the least defined resistance target levels and as such was the least important to me. The 1 min chart is leading negative here with a failure to confirm the gap up, again, this is what we saw in the last 3 bounces, failure to confirm strength.
The 2 min chart looks a lot like the Q's, a quick spike and then a leading negative divergence
The 5 min chart never confirmed the upside gap. $81.50 in the IWM is the closest thing to a shakeout level.
QQQ late day 1 min positive divergence, total failure to confirm. The Q's would be expected to benefit the most from AAPL as it holds immense weight in the NDX as they have (compare to the Dow gains), the failure to confirm and leading negative divergence seem to indicate that all strength-at least on the open, is being sold in to.
Like the 2 min IWM chart, the Q's show the exact same.
The 5 min chart had a bigger positive divergence, it is simply in line for the time being.
Similar to the DIA 1 min, the SPY is seeing a slight leading negative divergence on the 1 min
The 2 min failed to confirm by making a new high with price relative to this chart's history.
The 5 min failed to confirm as well, leaving a strong relative negative divergence.
Thus far everything is on track. We expected to see negative divergences in to strength and there they are.
AAPL up next.


No comments:
Post a Comment