Tuesday, May 1, 2012

Quick Market Update

Things are moving fast now, I'm just updating the SPY as I'm quite sure the rest of the averages look the same, but I will double check and let you know if there are any divergences standing out beyond these.

 SPY 1 min leading negative badly.

 2 min looks even worse! Yesterday's predicted bounce can be seen at the white positive divergence, look at where 3C is now compared to yesterday.

 The weakness has bled to the 3 min chart.

 And the 5 min is no longer in line but starting to lead negative.

Although I don't usually subscribe to "V" reversals, the parabolic nature of this move opens it up to the dangers of the right side of a parabolic move up and that is a move down just as bad or worse in momentum. The 15 min chart is clearly leading negative. I thought yesterday was difficult, today is turning out to be very difficult, very fast moving.

I'm going to be looking at some positions to initiate or add to, even if we manage more strength, we have made it to the zone predicted lat night so I personally don't worry too much if we get further strength as I have hoped for while entering a position in this area, I can deal with a little draw down, but the key for me is not having too big of a position size and a nice wide stop that allows enough room to add on additional strength. I can always fill out positions with the trade working in my favor.

Quick ES Update

A market update is coming next

 The ES negative divergence was expected, selling in to strength, it is really getting deep now on the leading negative side.


I'll try to look at our own Risk models if time allows, but as you can see the CONTEXT model which was supportive of higher ES prices is now reaching the median and is close to reversing with the model heading lower than ES so this looks like we are getting near the end of the bounce. The hardest part is the market is like a mortally wounded animal right now and that is when they are most dangerous and unpredictable.


More Market Manipulation

It should be fresh in everyone's mind how we see Gold as a measure of the "QE-Hopeful Crowd"sentiment. Here's but another example, but this time it also shows proof of another example I talked about Sunday night, "The F_E_D will give the market what it needs when it needs it" and what the market needs is strength to sell into. Bernie lately has been coming off as a bit of a QE hawk as far as that is possible for the man, so for him to be out there hinting at it would be very confusing to the market and his credibility regarding F-E_D transparency which along with using the US economy and all of our citizens as lab rats in his QE experiment which he argued against before he become chairman, his other seeming effort is to cement his legacy as the chairman that made the F_E_D transparent when compared to Alan Greenspan's "Green-speak" in which the man could talk for hours about policy and still no one had any idea of what he was thinking, Bernie is trying to be the anti-Greenspan.

So it is little wonder that  we have their mouthpieces out in full force like Paul Krugman who is getting more air/press time this week than in a year and today Alan Greenspeak himself (who also said QE was useless), all out making the case.

Greenspan to Bloomberg...

  • *GREENSPAN SAYS EQUITY STIMULUS IS HELPING TO DRIVE ECONOMY
  • *GREENSPAN SAYS EQUITY STIMULUS IS UNDERESTIMATED
Just to confirm that gold is now the true sentiment indicator for the QE crowd, take a look...

Gold falls intraday on a solid ISM print (remember for the QE addicted crowd, bad economic news is QE positive, good economic news is QE/market negative as shown in gold which tends to benefit the most from QE). Then we see a slight bump in GLD, why? Just look at the quotes above from Greenspan.

GLD's correlation is finally confirmed-it is a measure of QE sentiment.

AAPL and the Hedge Fund Hotel

First off, let me say that I WILL be slow on emails today, my first priority is to the entire group of Wolf on Wall Street members, my second is to individual emails as I try to give as much individual support as I can, lastly would be model portfolio trades, so the take away is response times on emails may be slower and if you are specifically waiting for me to make model portfolio trades, I may not have time to do so, you need to understand that if I do not do so it is not because of analysis, it is because of time. As usual, I post all model portfolio trades BEFORE I make them.

That being said, I have about 15% more to add to my AAPL equity short position which is at a gain already. I'm hoping for a great move in AAPL that takes out the post earnings highs, the trouble with AAPL specifically is the institutional positions in AAPL are so large that these hedge funds that all copy or follow the leader, are all doing the same thing and I'm nearly certain they are all trying to squeeze out the door at the same time. Dan Loeb's fund had AAPL as a top 5 position (usually they don't reveal much more than that) in February I believe, the next month it was not there. Loeb is well respected as a hedge fund manager and other managers are going to take the disappearance of AAPL as a sell signal. So AAPL will be under immense pressure at any strength as these positions are probably some of the largest out there.

Again, AAPL is a stock that you don't want to get lost in the lines with. I'm hoping for the best, I already have a decent size position in the model portfolio there and I don't need to add, so I'm kind of holding out for a great entry, but if it looks like a certain level is all I can get, then I'll be forced to fill in the rest of the position. Right now I'm still patient and hoping for a good move, you just have to understand AAPL is unique in that its size (and position sizes) mean any strength will be used to exit/short the stock.

The other thing to consider is this and I don't have data suggesting it, its just a gut feeling, Europe is a drag on any bounce with their macro data, while I can't say I'm expecting this bounce to reverse today, tomorrow when Europe is open it will likely be a drag on any bounce, just something to keep in mind.

Here's the AAPL update.

 AAPL not that impressive today, but not too far out of line with the broad market.

 1 min chart, this looks like the work of the hedge fund hotel.

 From where accumulation first tarted we can see it was higher, that IS NOT the average accumulated position, you have to average that area as well as the moves lower, so exactly where break even would be is hard to determine, but my gut would tell me that it would need to be higher. I'm not punting on this, I'm just being honest the way I se it, the "Every man for himself" mentality is probably strongest in AAPL, so the typical move that is well above the first accumulated area may not be a reasonable expectation, I do remain patient though for now.

The 2 min chart shows a SHARP leading negative on any strength from today.

 The 3 min with less noise shows clearly what is going on in AAPL as they get this gift of a bounce.

 The 5 min which looks stronger because of the accumulation period is already seeing a leading negative type divergence, so there apparently is a lot of distribution in AAPL. If the hedgies acted as a collective, they'd let AAPL go higher before selling/shorting as it would be to all of their advantage, but  very high paying management jobs are on the line, thus the "everyman for himself" attitude toward AAPL.

 The 15 min chart is just longer it takes longer for the divergences to accumulate there. Where it stands now tells me we can't rule out a bigger move.

 Since the capture of this chart with 2 support zones, the first has been taken out, volume jumped a bit as you can see as it was just being hit. The second thus far is holding and AAPL is caught between them. The move below the first zone could give AAPL a little boost and a brief move below the lower support zone could do the same, however breaking below the second zone starts to get touchy for AAPL's gains.

 This is the bigger picture, the parabolic move up, this is a weekly chart. These parabolic moves almost always fail spectacularly and AAPL's has already started on the 5 day chart. Keep the bigger picture in mind.

Also bigger picture is the horrendous 60 min leading negative divergence right at the AAPL top.

Point being, "Don't get lost in the lines". I'm willing to give AAPL some room and time, but I wouldn't miss the trade because I didn't get a new high above the earnings high.

BIDU Update

As you may remember from yesterday I started a short position in BIDU near the head fake area and as of yesterday that short (no leverage) was up for me over 9%. I have about 50% of the intended position size and yesterday I speculated BIDU would bounce and give us an opportunity to initiate or in my situation, add to the position. I like to short strength when there's underlying 3C weakness and I like to add to positions that are working (remember my "How to make more than 100% in a short" article posted yesterday from Trade-Guild.net) in my favor on countertrend bounces, like what we are starting to see in BIDU.

Here's today's update as this is one of my favorite longer term Tech plays as it's op pattern suggests it has barely even started.

 BIDU's almost certain triangle top, we waited for the head fake false breakout at the yellow arrows and started shorting BIDU in that area, since it has broken down below the false breakout area confirming it was a false breakout as we suspected before it even made the move. The real power in a downside move in BIDU will be when the triangle top fails around the $120 area, although that will be viewed subjectively by many traders, the point is, once that triangle is shown not to be a consolidation and fails, traders will be moving out of BIDU is flocks, sending BIDU lower much quicker. The yellow box is where I'd like to add to BIDU, but we have to take what the market gives.

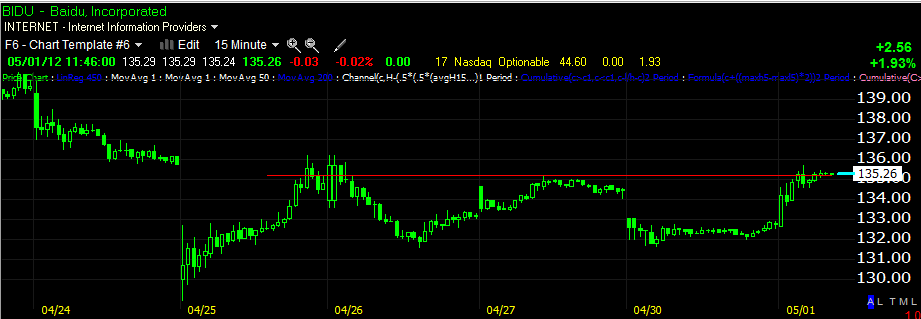
 BIDU is up nearly 2%, it is running in to local resistance so it "should" consolidate here, either through time laterally or through price with a pullback. Again the area I'm hoping to see to round out the position is around $142-$144, but there's so much potential downside I would suggest, "NOT GETTING LOST IN THE LINES" which simply means, keep the big picture in focus and don't miss out trying to trade too fancy and trying to hit an exact top.

 BIDU was showing signs of a bounce, that is why I featured it yesterday, there's a negative 1 min divergence, you can see clearly the intraday highs hit some local resistance and momentum traders are taking that as a failure of the test of resistance, Wall Street isn't necessarily thinking the same way.

 The 5 min chart is still in line with price, which means it can still move higher, it hasn't deteriorated that badly to preclude that possibility.

 If you have price alerts that you can set in real time (most Worden platforms have this function), you want to look for a move above the $136 area, a break through resistance.

The 60 min Trend Channel has held the move down from the head fake area very well, this trend down will be broken on the Trend Channel at nearly exactly the same spot as resistance (the Trend Channel is one of my proprietary indicators that measures each stock's recent volatility to define what is "normal" and what is not normal. A break above the lowest point of the upper channel would be "not normal" for the downtrend and suggest a continued move higher. If you were long BIDU right now or looking for an area in which the move up may start to fail, it would be below the lower trend channel's highest point, currently around $132.50.

I'm going to be patient and try to get the most I can out of this trade, but that is my style, you have to do what works for you, but that i my take on BIDU as of now

Market Update

Luckily Telechart is back up, unfortunately StockFinder is still updating data, I usually use SF for market updates because of the diversity of timeframes and the longer bar history. For now, until SF has finished downloading market data, I have to use Telechart, not as specific as I would like, but better than nothing.

 All of the 1 min charts like this DIA have at least moved up, but are showing some negative divergences, this is the selling in to strength or shorting it that is the very reason for the entire move higher since April 10th. I don't know how far along this is in to the 2 and 3 minute charts, but below we have the 5 min charts.

 DIA 5 min shows a slight negative, but mostly still in line, so I'm sticking with the "U" shaped reversal rather than a "V" based on what I see, but when the reversal does come, the "U" shape should be sharper than usual, more of a parabolic curve.

 IWM 1 min showing distribution as expected.

 The 5 min from yesterday's positive is still in line with price so no negative divergences have been strong enough to effect the 5 min yet.

 QQQ-seeing strong 1 min negative divergences

 5 min is still in line

 SPY seeing strong 1 min negative divergences,

The 5 min is still in line.

The picture I get here is the market is doing what we expected, but there appears to still be time left, I'm not expecting an imminent crash.


GLD and QE sentiment

Also from last night's post...

"Here's GLD vs the Euro (proxy for the dollar), note that gold moved up in to the green today, despite the $USD correlation that would suggest otherwise, since GLD is the primary beneficiary of more QE, which I must at this point mention, Paul Krugman has been everywhere in the last 4 days calling for more QE, I think as I suspected early today, the QE-hopeful crowd seems to have spun the bad economic reports in to good news thinking Bernie has to ease with the economy faltering. I mentioned last week after the F_O_M_C announcement that GLD would be the barometer of QE hopeful sentiment; in their eyes, the weak economic data is QE positive, therefore gold and market positive."


If I just showed you the GLD daily chart you wouldn't get the feel for the concept above, but if you look at the intraday chart and 10 a.m. specifically, you can see the QE hopefuls dreams were temporarily crushed based on the ISM print.


For months we have been trying to figure out whether GLD was a risk on asset or a flight to safety trade as it has gone both ways or if there was no correlation and GLD was just doing its own thing which I suspect is putting in at least an intermediate top, maybe longer.


The trend in GLD right now is clearly a QE sentiment driven one at least in the near term so that question has been answered for the time being.


Anything look familiar?

From last night's post...

"If Europe can hold up overnight, but even if it can't, I see no reason to throw extra support/$$$ in to the market and not force it to finish it's cycle which should look something like this..."


And Today...

Pretty darn close...

ES Update

This is the move we were prepping for yesterday, again patience has been one of the hardest lessons for me, but it has paid off thus far. As you can see, 3C is NOT confirming the move higher in ES; this is to be expected as the point of the volatility shakeout is to sell in to strength. As for reversals off this move, there are several concepts that may clash with each other today, 1) the market rarely holds large early gains (or losses) this early in the day, lately though as you may have seen in my last volatility chart, we have seen the market do so (over the last week +) with the market opening at lows and closing at highs and vice-versa, so while the trend is to be respected, it's clearly starting to unravel. The second concept is the same as yesterday, "Reversals are rarely "V" shaped" and as we saw yesterday they typically take some time. Other than that, this is where we want to be looking at shorting in to strength.

Thus far the ES CONTEXT model remains supportive of these higher prices and apparently it has head room for even higher prices as the model is still quite a bit above actual ES.

As I said, yesterday was a day for patience, today is a day for action.

I'll do my best to keep you updated until the servers are reset.

Spoke too soon

Apparently Worden has fixed their servers, I had real time data for a few minutes and then lost it. The latest update is that the server issue is resolved, they are just bringing them back on line, so still limited to what I can see for the moment.