As you may remember from yesterday I started a short position in BIDU near the head fake area and as of yesterday that short (no leverage) was up for me over 9%. I have about 50% of the intended position size and yesterday I speculated BIDU would bounce and give us an opportunity to initiate or in my situation, add to the position. I like to short strength when there's underlying 3C weakness and I like to add to positions that are working (remember my "How to make more than 100% in a short" article posted yesterday from Trade-Guild.net) in my favor on countertrend bounces, like what we are starting to see in BIDU.
Here's today's update as this is one of my favorite longer term Tech plays as it's op pattern suggests it has barely even started.
BIDU's almost certain triangle top, we waited for the head fake false breakout at the yellow arrows and started shorting BIDU in that area, since it has broken down below the false breakout area confirming it was a false breakout
as we suspected before it even made the move. The real power in a downside move in BIDU will be when the triangle top fails around the $120 area, although that will be viewed subjectively by many traders, the point is, once that triangle is shown not to be a consolidation and fails, traders will be moving out of BIDU is flocks, sending BIDU lower much quicker. The yellow box is where I'd like to add to BIDU, but we have to take what the market gives.
BIDU is up nearly 2%, it is running in to local resistance so it "should" consolidate here, either through time laterally or through price with a pullback. Again the area I'm hoping to see to round out the position is around $142-$144, but there's so much potential downside I would suggest, "NOT GETTING LOST IN THE LINES" which simply means, keep the big picture in focus and don't miss out trying to trade too fancy and trying to hit an exact top.
BIDU was showing signs of a bounce, that is why I featured it yesterday, there's a negative 1 min divergence, you can see clearly the intraday highs hit some local resistance and momentum traders are taking that as a failure of the test of resistance, Wall Street isn't necessarily thinking the same way.
The 5 min chart is still in line with price, which means it can still move higher, it hasn't deteriorated that badly to preclude that possibility.
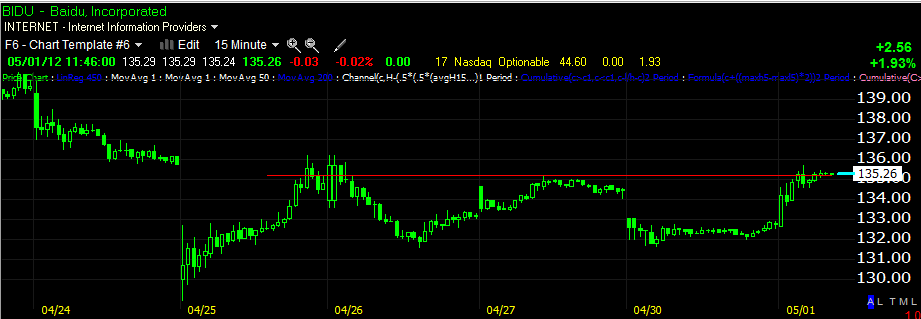
If you have price alerts that you can set in real time (most Worden platforms have this function), you want to look for a move above the $136 area, a break through resistance.
The 60 min Trend Channel has held the move down from the head fake area very well, this trend down will be broken on the Trend Channel at nearly exactly the same spot as resistance (the Trend Channel is one of my proprietary indicators that measures each stock's recent volatility to define what is "normal" and what is not normal. A break above the lowest point of the upper channel would be "not normal" for the downtrend and suggest a continued move higher. If you were long BIDU right now or looking for an area in which the move up may start to fail, it would be below the lower trend channel's highest point, currently around $132.50.
I'm going to be patient and try to get the most I can out of this trade, but that is my style, you have to do what works for you, but that i my take on BIDU as of now


No comments:
Post a Comment