Wednesday, May 30, 2012

ES Update

ES did pretty much what I expected, it stayed in a lateral "flat-ish" zone and 3C kept improving.

USO Calls added-July $32

Going to go for USO July Calls

This is still what I consider a speculative position as it runs counter to the major market view, that means I reduce my risk on these positions. For instance, if you use the 2% rule, you might reduce risk to 1%.

I'll let you know what strike in a moment.

USO Update

USO is continuing to loo better.

 The 1 min leading positive made another even stronger divergence at the 12:30 lows

 That strength i migrating to the longer term charts where it wasn't before, note the divergence is stronger at the 12:30 low

USO 3 min, again the divergence is stronger at the 12:20 low.

I'd like to see a little more improvement and then I will likely look in to some July calls. There are several long ETFs and leveraged ETFs for oil as well like USO and UCO

Head Fakes and the Bear Flag/Pennant

I have a few charts and one paragraph to post, first the charts...

 The overall bear flag divergences on a 30 min chart-for newer members 30 min may not seem like a ling time, but a 15 min negative divergence is all it took to turn the market down from the May 1 highs, a 30 min chart is much more influential and this is a much bigger divergence in leading positive position, a divergence this big rarely fails, I can't remember the last one this big to fail.

It's all about the bear flag/pennant in the white box.

The medium term strategic outlook is pretty firmly set. As for the Big picture Primary Trend, that is also firmly set.

Daily 3C leading negative divergence, very ugly, a daily leading negative divergence this deep and this fast is very rare, the big picture is this market is in a boatload of trouble. However, firt things first and that is the medium term outlook.

As I mentioned this morning, just because the market is extremely bearish doesn't mean it can't or won't put in a spectacular counter-trend move to the upside.

 To the left is the 1929 Dow Crash, there were at least 5 counter trend rallies, the first lasting about 5 months for better than a 40% gain and during a raging bear market. To put that in perspective...

The SPX recent rally from the October lows, about 7 months for a 29% gain, as mentioned many times before, bear market rallies tend to be sharper, more intense than bull market rallies.

Now just a paragraph from this post last Friday as I try to anchor expectations and give you some idea of what a move may look like...

Big Picture-Not Too Big

The chart of the bear pennant from last Friday's post linked above and what was written below it...
"Here's the pennant and the white areas are where there have been strong positive divergences, buying price weakness, it's exactly what we did on Wednesday the 23rd with gains in all of those positions, the same thing seems to be happening, whether we move to the lower trend line and post a head fake break down move or not is difficult to say, but I think the upside head fake move is more certain, it's just a matter of timing at this point "


As I once in a while remind you and myself, "Don't get lost in the lines", meaning focus on the bigger picture and use (in this case) weakness as a tactical advantage to further your strategic view. The strategic view for the mid term being a sharp market bounce, for the longer term, a very bearish market and a bounce will just further the cause in being able to short in to price strength.

ES Update

Just about 30 mins ago in the ES update I wrote the following,

"ES positive divergence right around the 11 a.m. low then a leading positive. Normally I would suspect a flat-ish range to carry on for at least a few hours, testing the area around the 11 a.m. low, at this point I would expect to see 3C continue to make higher highs (larger positive divergences), NORMALLY."


And ES now...


So far continued positive ES divergences and in a leading positive position as ES tests the 11 a.m. lows and remains, "Flat-ish".

USO Update

As I mentioned, I'm pretty well hedged for the core shorts in the equity model portfolio, but I'm not opposed to going after a few spec trades with options. It really doesn't matter what I choose to do, options, leveraged longs, regular longs, the point is the asset and something seems to be going on with oil/USO. I'm not ready to commit to a new trade there, but I will be watching it very closely for continued improvement, this is out of the ordinary.

 USO 1 min at 11 a.m. is flying in a positive leading divergence.

The longer 15 min chart shows USO in a longer term overall good position as this entire divergence is leading positive and quite large. To fulfill the divergence, the EUR/USD would HAVE to move up.

The point being, all of the long term shorts we build positions in from March to May were done in the same manner, the longer term strategic view was very bearish, we just waited for price strength and an ugly negative divergence in to that strength to start the shorts or add to them.

This is the exact opposite as a long trade, the strategic view on the 15 min is very positive, price is low and we are seeing the start of a huge leading positive divergence. This is the exact same way we entered all of those shorts that are profitable and entered them at low risk/high probability areas. Being this is a speculative long, you just flip the divergences and we have the mirror opposite position now. Just as we shorted in to price strength and 3C weakness, USO is showing what may turn out to be a good buy spot at price weakness and 3C strength.


11 a.m. low looks important

 DIA 3 min remains leading positive, not effected at all by the gap down and by this time in the day the 3 min charts (actually all the way out to 5 min charts) are fully updated.

 ES positive divergence right around the 11 a.m. low then a leading positive. Normally I would suspect a flat-ish range to carry on for at least a few hours, testing the area around the 11 a.m. low, at this point I would expect to see 3C continue to make higher highs (larger positive divergences), NORMALLY. We have to also consider one of the first posts I wrote yesterday, Technical traders on the bear side (which is nearly everyone) will be looking for a failed test of resistance, I showed you yesterday where they entered on a breach of intraday support after the "apparent" failed test. This post was telling you early yesterday what to watch out for. So with shorts now firmly committed on the "apparent " failed test of resistance, it's hard to say if "normal" will apply in this situation.

 IWM 1 min (the chart that had the afternoon negative divergence yesterday) is positive at the 11 a.m. lows and like ES, now leading positive.

 IWM 2 min which I showed you a few posts ago has stayed leading positive, it also put in a positive divergence at the at 11 a.m. lows. The reason I mention this chart is because the 3 min carries more weight than the 1 min and it showed up here too.

 QQQ 1 min positive right at the lows and like the others, a leading positive right after.

 SPY 1 min in leading positive position, not effected by the gap down at all and this is the most sensitive timeframe, also shows another relative positive divergence at 11 a.m. and a further new leading positive high just after.

 What is going to move the Euro? It seems like nothing, "seems" and that's why there's huge record short interest in it, that is motivation enough to move the Euro, by what means or catalyst, I don't know, I don't even think it's important, but the fact the most sensitive 1 min chart stayed leading positive in to a gap down, says something, also note the further leading positive this a.m., again at the 11 a.m. lows

 The 3 min chart as mentioned under the IWM 3 min chart is harder to move than the more sensitive 1 min, it too  stayed and went positive at 11 a.m. lows.

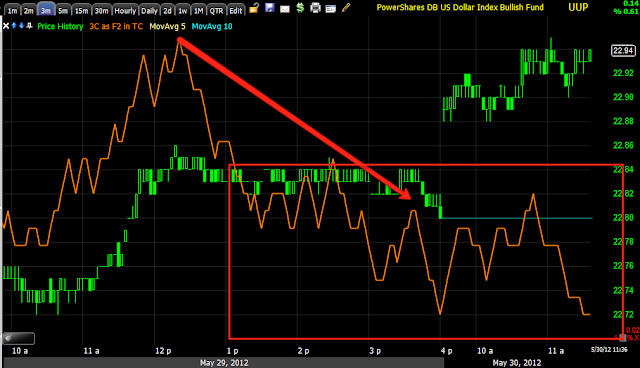
 The $USD 1 min stayed leading negative-confirmation in the EUR/USD pair.

 2 min $USD stayed negative

3 min USD stayed negative.

Trades...

I'm going to look around for some long trades/hedges if any one needs them. I'm nearly perfectly hedged as this move down has moved barely moved the long term equity model portfolio. I had picked up some leveraged long positions to juice returns on a short squeeze and hedge the longer term short positions that I am not planning on covering. I don't have time for portfolio management and figuring out precisely what I needed to hedge as the model portfolio is my last priority (first is to all of you, second to individual emails, last model portfolio), however I luckily guessed correctly on position sizes for the leveraged long ETFs so I really don't need to move much around there, but I like the open so far and it looks like an opportunity to add or initiate some speculative longs/hedges for core shorts you may be planning on holding, it's just a matter of seeing where the high probability/low risk set ups are.

I'll report back.

Actually it was the IWM...

The chart I mentioned that had a 1 min negative divergence in to the afternoon yesterday as the IWM, not the QQQ, but this allows me to show you what I was talking about in the last update about charts at 2 and 3 mins not being effected today.

 IWM 1 min chart from yesterday, from left to right: positive divergence with the rest of the market at intraday lows around noon time, negative 1 min divergence going in to the afternoon trade, this was the only chart that ended that way and is only a 1 min chart so it's not a big negative divergence. This morning it is lower at confirmation with price with a positive divergence developing. Now the more important part...


The same IWM, but 2 min (the higher the timeframe the more significant the divergence, however in early trade the short term timeframes are important to judge the strength of divergences, for instance this 2 min chart allows us to judge the strength of the 1 min negative divergence above). This is a little longer history as well, showing Friday's late day accumulation, Tuesday's gap up and noon time accumulation, the green arrow is price/3C confirmation of the trend and the 2 min chart is currently in a leading positive position, if it were to confirm lower prices 3C would be down around where price is like the 1 min chart above. This tells us the 1 min negative divergence from yesterday in the IWM and this morning's confirmation of the move down are not strong underlying trade signals at all as they haven't moved the 2 min chart (the next timeframe) out of its leading positive position and this is what I was explaining in the last post.