Wednesday, June 20, 2012

Quick Market Update

As you probably recall from recent analysis, I have expected the market to pullback in the near term or short term trend (this is longer than intraday, it could be several days or more, but it is not nearly as long as the intermediate uptrend seen on the 30-60 min 3C charts).

The charts this morning are largely in line with price and a continued pullback. The sub-intermediate 3C trend (30-60 min charts) are still very positive.

Basically from the charts I'm expecting a pullback and then a resumption of the move up (sub-intermediate trend).

Watch out for F_O_M_C volatility, remember there's almost always a knee-jerk reaction, I'd be careful in not reading too much in to that action unless the policy statement changes policy dramatically, such as introducing QE3.

FB Update

As you know, I've been looking for a pullback in FB, I suspect I will look to open some new call positions in FB on the pullback so long as the underlying trade remains positive as the very positive 60 min chart suggests. Yesterday I showed you a clear technical price pattern and speculated that it would be used in a head fake manner to start the pullback, today FB is starting to pullback (-1.85%).

This is the chart shown yesterday with a clear bull flag (bullish continuation/consolidation pattern), which means technical traders expect FB to break higher.


From yesterday below this chart... "FB has formed a bull flag/pennant, this is a bullish consolidation/continuation pattern, while I'm not sure how many people are buying FB, obviously some are so there's a chance for a head fake move on this price pattern as price now is right around yesterday's resistance."


Today's move...
 Here's the initial suspected False break higher, I'm looking for a pullback even deeper from here.

 The 1 min chart's trend suggesting the pullback, I'll wait to see a positive divergence in to the pullback.


 The 60 min chart suggests we will see higher prices and an opportunity to enter a long position at a better price with less risk.

The hourly Trend Channel started with a stop below $26, it has now locked in gains to $31.

I'm going radio silent until after the F_O_M_C unless I see something that needs to be reported.

GLD/GDX/GDXJ

As mentioned earlier, we expected a near term pullback in GLD and miners, I also showed you early signs of intraday positive divergences in GLD and miners, those are growing. I'm not going to read in to this too much, but as you know, GLD has been acting as a QE sentiment indicator.

As for GDX, this is what I said in an update,

"I'm going to post the charts, but basically it looks like a near term pullback in GDX, perhaps a little base building and another move higher." 


My view on GDX was that it appeared that the negative divergences were not that bad and only looked like they were there to create a pullback, while the longer term charts still looked very good, so we would expect to see accumulation in to the pullback, however I would have also expected a deeper pullback, but there's nothing stopping the miners from pulling back more in the coming days. Thus far it is good to see the positive divergences in to the pullback as it agrees with the analysis from yesterday, the timeframe issue is what is the question in my mind and whether this has anything to do with the F_O_M_C policy statement on 30 mins away.

 GLD 2 min leading positive intraday

 3 min is starting to lead positive in GLD

 As is the 5 min

 GDX/Gold Miners 1 min leading positive intraday

 GDX 3 min leading positive

 Junior Miners/GDXJ 1 min leading positive

 2 min leading positive

5 min leading positive

CONTEXT

 CONTEXT for ES show the model higher than ES, it seems some of the underlying markets are doing a bit better than the ES relationship shows.

The SPY arbitrage model is also higher than the SPY.

A quick look at our risk asset indicators shows High Yield Corp. Credit outperforming the SPX intraday, it's off a bit from yesterday's highs, but diverging positively with the SPX.

The Euro and especially the $AUD (which is my favorite leading indicator among the currencies) are diverging positively with the SPX, the $AUD thus far looks very good.

Yields are also outperforming  significantly intraday.

High Yield credit is in line with the SPX intraday.

Commodities are underperforming.

As for relative momentum in the 3 major industry groups, Financials and Tech are showing much better relative momentum.

GLD Update

From yesterday's GLD update

 "3C showing distribution in to that big move up and a recent negative divergence as well. To me, it looks like GLD is coming down."


 GLD 5 min chart sees GLD gap down over 1% this morning.

 The daily chart of GLD today

 This is the very negative looking 60 min chart, remember we had a very positive signal on May 30th which sent GLD higher, that move was sold in to and 3C has been leading negative since, this is why I said I thought GLD was coming down near term, however the daily chart has a positive divergence which is strange and we discussed some possibilities yesterday as to what this may mean.

 The 1 min chart this a.m. looks to be in line, but...

 The 2 min chart looks much more positive. Is it possible they are moving GLD down to buy at lower prices? We'll have to see if the divergences really show a strong signal, but we don't have much time before the policy statement.

Interestingly, as I suspected as well in the GDX update, miners have also dropped nearly 1.75% this a.m. as expected, however they are seeing some stronger intraday positive divergences on the 1 and 3 min charts.


I'll be keeping a close eye on GLD, the daily positive divergence is a most interesting feature.

EIA Petroleum Report

Released at 10:30...

Released On 6/20/2012 10:30:00 AM For wk6/15, 2012
PriorActual
Crude oil inventories (weekly change)-0.2 M barrels2.9 M barrels
Gasoline (weekly change)-1.7 M barrels0.9 M barrels
Distillates (weekly change)-0.1 M barrels1.2 M barrels


Crude saw a build of 2.9 mm barrels, I don't know what consensus was, but generally a build is not great for oil's price.

As for the charts...

 The reaction on a 1 min chart to the 10:30 release

 The daily USO chart with a downtrend and a bearish descending triangle (consolidation/continuation pattern) implying the next leg down is set to start. We have seen quite a few of these patterns lately head faked to the upside on at least brief, but strong moves, take GLD for example which looked nearly identical before seeing its biggest 1 day gain since 2009.

 The 5 min chart mentioned earlier showing a negative divergence going in to this gap/island-like area.

 The longer term 15 min chart looking somewhat positive at the bearish price pattern.

 The 60 min chart looking pretty good at the bearish price pattern.

The 1 min intraday response to the report, it looks muted, but there appears to be some stabilization.

I'll keep an eye on this to see if we may get a move worth trading.


Overnight and in to the open

Overnight rumors and press articles have been speculating about the possible size of the EFSF and yet to be ratified permanent bailout mechanism, the ESM. Furthermore there has been a lot of talk regarding the size of the temporary and permanent facility in terms of what Italy and Spain may need.

The June Bank of England minute for June were released showing a vote of 5/4 to keep asset purchases (QE) at the current level of $325bn, the surprise in the minutes was that 4 people had voted to increase QE as the market had only thought 2 had called for additional asset purchases.

The market is waiting for the Greek coalition government to be sworn in which is expected today or tomorrow.

As has been expected partly as collateral damage, Italian yields are at the unsustainable level which gave rise to yesterday's rumor/rampfest  which was based on the headlines that Italy had proposed at the G-20 conference in Mexico that the EFSF and ESM bailout mechanisms should effectively be used to replace the ECB's SMP program and that Germany had taken the proposal favorably and it was being discussed. Broken down in to English, this would mean the traditional role of supporting sovereign yields by the ECB buying in the secondary market through their SMP mechanism would be taken up by the ESM and EFSF, as we found out later in the day this was pure rumor and had been denied as only an idea, no discussions were held regarding implementing anything and at VERY BEST, it was simply an idea proposed by Italian PM, Monti, but the real news was that Italy was in a round-a-bout way, asking for a bailout of shorts confirming the notion that Italian debt burdens were reaching the critical stage with the denial of the rumor leaving Italy with no recourse or hope of their bonds being supported to hold down unsustainable yields.

Overnight this idea/rumor was put to rest once and for all by the real authority and decision maker in the EU, Germany.

BERLIN (MNI) - The German government on Wednesday reaffirmed that
the European bailout funds EFSF and ESM won't be able to buy bonds of 
EMU member states on the secondary markets without these countries 
applying formally for such aid and accepting the conditions tied to it. 

     "Such secondary market purchases are foreseen as one of several 
instruments in the EFSF as well as in the future ESM," government 
spokesman Georg Streiter said at a regular press conference here. "They 
are naturally tied to conditions and there won't ever be any purchases 
without conditions." 

On Greece:

     Commenting on Greece, Streiter said Germany expected that the new 
government there will abide by the fiscal consolidation and reform 
program agreed with the EU, the ECB and the IMF.

    German Finance Minister Wolfgang Schaeuble told German weekly Die 
Zeit in an interview to be published Thursday that "we did not ask too 
much of Greece and we won't ask too much of Greece." 


From Bloomberg:

VENIZELOS SAYS CONDITIONS FOR COALITION BEING MET, He adds that the key issue will be to form a bailout renegotiation team. 
  • Says ND, Pasok, Dem Left will take on burdens; caretaker finance minister to go to Eurogroup
  • Greek party leaders to meet Finance Minister Zanias tonight
  • Venizelos says EU summit will be battleground for bailout talks
This is not really overnight news, but the term financing for inter-bank lending has seen an inverted curve, meaning it is more expensive to fund short term loans like overnight loans that are used to meet withdrawals of deposits. In essence the cost is rising as we are seeing the same counter-party risk we saw in the US in 2008-2009 that locked up our credit markets. This is a sign of 2 things: 1) The flight of deposits capital in EU banks is accelerating 2) the distrust of counter-party lending is increasing. All in all, not a good sign for the already severely undercapitalized European banks. Longer term loans are being nearly avoided altogether.

_______________________________


Just around the time of the US open, we get the following news:

GREEK NEW DEMOCRACY LEADER SAMARAS SWORN IN AS PRIME MINISTER


In the US:

The F_O_M_C policy decision comes at 12:30 with  F_E_D forecasts at 2 p.m. and the Bernie presser at 2:15.

There have been tons of projections from QE to Twist to LSAP purchases, in a pol about 70% of market participants expect some F_E_D easing, I'll not speculate any further than what was said yesterday.


As for ES/FX...

 Last night ES wasn't looking very good on 3C, it fell and remained range bound in to the European open at the green arrow.

 Pre-market ES saw a large relative negative divergence which sent ES lower in to the NY open.

 EUR/USD since yesterday's 4 pm close to present

The pair since open of FX trade for the week, above major resistance, but near Sunday's opening gap level acting as resistance


Since this morning's 9:30 open...

Market Updates up next


EIA due out in mins

Quickly the USO 1-5 min charts have fallen apart badly bringing USO down, the 15 min chart though is holding up well as is the 60. We'll watch for possible trades in USO on the EIA data

Tuesday, June 19, 2012

Putting the Pieces Together

I won't act like a guru and claim with absolute certainty that I understand what dynamics are either in play or about to come in to play in the market, but I will show you what I have found and hopefully we are on the right track. We have a huge advantage over the Sheeple, 3C isn't perfect, if it was I'd already own my a private island, but I can say in all honesty, it is one of the most unique money flow indicators and effective at that. While we may not know why, we certainly know what.

For example, 

 Take a look at the $USD, there's a clear reversal there.

 3C 60 min $USD not only warned us, but warned us with plenty of notice. The shorter term timeframes actually pinpointed the May 1 reversal in the market/FX market, we even knew what the decline would look like later in the afternoon as the morning saw a parabolic move up.

If we had used the long time Technical Analysis standard money flow indicator, On Balance Volume, this is what we would have seen...
Do you see a signal in the $USD suggesting a reversal?


As for the Euro...
 As Greece was without a government, elections polls looked like Syriza would win and throw the EU in to chaos, there was a French election that ended the Franco-German era of cooperation, numerous banks and sovereigns were downgraded, and on and on; who would have predicted the Euro would reverse to the upside?

We may not have known why, but 3C told us what was going on. In my experience and just as a matter of common sense, if you wait for the answers or certainty, your opportunity to make money has already past.

If we were to look at the market as the sheep who blindly follow the dogma of Technical Analysis without observing, learning and adapting, how do you think this would have turned out?
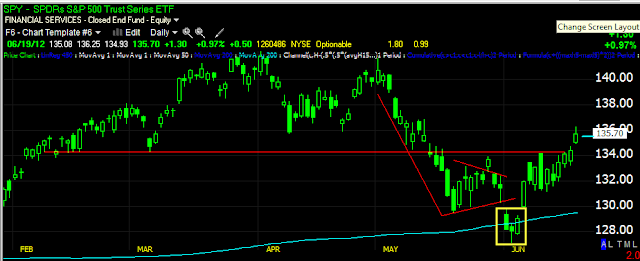
The SPY shows a traditional Head and Shoulders top, the break of the top is one area technical traders would have shorted, a bear flag/pennant formed telling traders that the next leg down was ready to begin; the SPY broke below the bear pennant where traders would have shorted the market, then it broke the 200 day moving average, another place traders would have shorted the market. However, from 3C signals and other indicators, we not only predicted the false break down, but also the move up to follow. It's not a matter of luck or being a guru, it's a matter of thinking for yourself, observing and adapting. Many members have made many excellent money making trades nearly every single day and as far as being short (as the primary trend is very ugly), our shorts were opened at the top of the H&S pattern. Right now in the equities model portfolio (where the longer term primary positions are), 9 of 11 positions, both long and short are all in the green with gains as high as 18% (using no leverage at all), the 2 long positions still in the red are at  loss of -0.31% and -0.91%!

As for the F_O_M_C meeting and policy statement tomorrow, I can't tell you what will happen, but we have some interesting findings. The Euro looks like it wants to move higher in a short squeeze, the $USD lower. The market averages look like they want to move higher (I'm talking about the sub-intermediate trend as I believe in the short term trend we will see a pullback).

We know gold has been acting as a sentiment indicator, today's GLD update was pretty much in line with the GDX/Gold Miners update , although GLD seemed to offer more in the way of the big picture. The gist of the update was GLD looks like it will pullback, yet the daily chart is more positive now than it has been since this time last year. As you will see below, Treasuries look to be under accumulation which is at odds with the market and FX signals we are getting and the same signals that have kept us on the right side of the market since March.

I shouldn't be speculating like this, but after looking at the Risk Asset close and some other indications, my best guess is that the F_O_M_C will disappoint the market with a lack of QE, in fact I don't even think it will be mentioned (as in the Jackson Hole Speech of 2010) beyond some possibly more dovish than usual, "We stand ready with an array of policy tools to step in should market conditions warrant intervention" or something along those lines. This may bring the market pullback I've been expecting and the Euro may be the catalyst for the short squeeze, meanwhile GLD I expect to pullback, but most probably be accumulated for QE possibly later this year. By the looks of treasuries, I would not be surprised if some policy adjustment was made that may be favorable for treasuries.

That's my gut feeling, but I would not go betting the farm on a gut feeling in front of a total wild card. Perhaps 3C has looked so positive lately because the F_E_D is going to do something that will be a market positive, just not immediately a gold positive. Of course I could be dead wrong, but that's my take and relies on a lot of assumptions.

As for the risk asset layout...

 Commodities performed well today vs the SPX.

You may remember last week I said the risk asset layout indicators were going to need to get back in line and soon as many had diverged negatively, like commodities, today commods are back in line, which is supportive of higher prices over the sub-intermediate trend.

 High Yield Credit has been the most bothersome lately, today it performed well and closed at its highs on the day.

 Yesterday I said that High Yield credit was at least making higher lows, it remained to be seen if it would make higher highs as well, today that was answered and while HY credit is still disconnected from the SPX, it is now moving in the right direction.  HY Credit is one of the assets used by smart money in a risk on move as the credit markets are so much bigger than the stock market, also credit is traded almost exclusively by smart money, hence the expression, "Credit leads, stocks follow/confirm".

 High Yield Corp credit has been behaving much better than HY credit, however I was concerned that it was just trading to the top of its downtrend channel and once it reached the top, it would turn down to reflect HY credit's less enthusiastic (at least as of the last several days) reality. As you can see, HY Corp. credit has blown through the top of the channel, it is likely there will be a short squeeze in the asset which should further lend support to the market. At least for now, that concern is allayed.

 Intraday HY Corp. Credit acted well.

For the sub-intermediate uptrend, HYC credit is now in line and supportive of higher equity prices.

 Yields which are another leading indicator have recently been a cause for concern as they have diverged away from the market, today they acted well, although the market closes an hour before the stock market.

 In white, Yields lead the market, in red they are negatively divergent; I mentioned yesterday it looked as if the found some support, today they rallied off that support.

 The $AUD acted well today

 For the sub-intermediate trend, $AUD is in line and supportive.

 Here on a longer term chart you can see how the $AUD has been a leading indicator at important inflection points.

 The Euro and market acted well today

I was a bit concerned about the Euro diverging, but it has moved in line

 Energy which had horrible relative momentum yesterday, improved today.

 Short term Energy looks as if it could pullback, but it also looks to be the strongest short term between Tech and Financials.

 Longer term or sub-intermediate trend, you can see the negative to the left and the positives in Energy at the bear flag, at the market new lows and leading positive now. This suggests higher prices.

 Financials were ugly yesterday, today they had much better momentum

 Short term 1 min there's that negative divergence (pullback I've been expecting).

 Longer term (60 min), Financials are positive enough.

 Tech was looking better yesterday momentum wise, today it slipped a bit; I feel good about having taken some risk off the table and locking in some profits in AAPL, the AAPL calls were sold today near the high of the day on the floated rumor which as predicted was subsequently denied, so the rumor was a gift and I feel good about using it to lock in profits.

 Tech 2 min looks like it wants to pullback

The hourly shows several divergences and looks good.

As for sector rotation today, as you can see Financials were in rotation, Tech fell out, Discretionary, Industrials, Basic Materials, and Energy were all in rotation. The flight to safety trades all went out of rotation today.

 While copper itself is close to confirmation with the SPX, FCX is in confirmation (SPX in red).

Transports are also confirming if you are in to Dow Theory.

 Here's TLT/Treasuries saw some intraday negative action, but...

 as mentioned, there seems to be accumulation here which is odd considering it usually trades opposite to the market.

The daily chart is even more positive, this is why I suspect something positive will be announced tomorrow in the Treasury space.

As for ES tonight...
Because of the move higher in ES, 3C is not scaled properly, there was a leading negative earlier in the day which I have marked, there was another at the rumor that ramped the market and then was denied, as I said, it was a gift and I'm glad I used it. In context to the normal hours, we have a large negative divergence in ES right now, perhaps this is the start of our pullback.

EUR/USD

The Euro is above the resistance zone, but looking a little out of gas here, this would also make sense with a market pullback. The red arrow is the close.

So that's where we stand, what I feel are the probabilities, however tomorrow will be a very volatile day; as I always warn in front of a F_O_M_C policy announcement, "Beware the knee-jerk reaction", it is almost always reversed.

I got about 3 hours sleep last night, but I will be back with more later.