Tuesday, July 10, 2012

ES-Short Term intraday update

There are a couple of 1 min positive divergences, the QQQ and IWM (even though the IWM 1 min trend looks horrible), that fall in line with earlier comments about intraday action today and not being sure we are done with the gap. I can't say for sure we won't move higher in to the gap on an intraday basis (and that may even help with positioning of trades like USO), however it looks pretty clear that the expectation of negative underlying activity in to any price strength  will be sold in to a originally expected.

I'm using ES as an intraday marker...
 Just as the intraday 2, 3 min etc charts that suggested a move in to the gap are deteriorating, CONTEXT for ES is also deteriorating as the model is below ES.

ES short term 1 min intraday positive divergence.

Hopefully this may help with USO and a few others various members are looking at.

USO Update

Still looking for a decent short entry in USO. I feel pretty confident oil will fall back, however a good entry in to the position is what is lacking and I'm hoping we might see such an entry today.

 While the $USD is the currency oil has its correlation with (inverse), because the Euro is so tightly correlated to the $USD (again inversely), it makes for easier analysis of divergences. Basically oil/USO and the Euro should move roughly together, however that has not been the case  over the last week or so. In my opinion, this lack of FX correlation puts USO on shaky ground.

 USO negative at yesterday's intraday highs and a slight positive divergence this a.m., I'm hoping USO will see some price strength intraday in to solid negative signals.

 A closer view of the 1 min this morning.

 The 2 min is seeing some migration of that 1 min positive divergence, this is why I have some hope that USO will move higher intraday and hopefully in to solidly negative divergences.

 The 3 min chart is leading negative since a relative negative divergence at yesterday's highs.

Ultimately between the FX dislocation and the 30 min chart's negative divergence, I think USO cold be a worthwhile short trade and even though I have confidence USO will move lower, a decent entry can often mean the difference between a successful position and a failed position.

AAPL Update

Yesterday I opened an AAPL August $615 put

"This is about a normal size position, you may get a little better intraday price, but this is fine for me here."


Here's this morning's AAPL update, needless to say (and after looking at today's charts), if I liked it yesterday, I still like it today.


 The AAPL 5 min chart's negative divergence was really enough for me to take on the PUT position.


 The short term intraday action on the 1 min chart is negative and starting to build, this should keep up and should migrate to the next longest timeframe.

 That would be the 2 min chart which is just in confirmation as of now.

 The 3 min chart wasn't influenced in the short term gap higher and remains negative from the larger divergence that has been building in AAPL (along the lines of the overall market pullback move).

 AAPL's 15 min chart...

And 30 min chart.


All in all, I have no problems with the AAPL position, I suspected I might not get the best entry yesterday, but given the divergences that wasn't a huge concern.


As mentioned above, I liked it yesterday, I still like AAPL for a decent size pullback.

SPY Market Update

As you probably remember we had positive intraday divergences mostly in the SPY/DIA from the 1, 2, 3 and some 5 min timeframes, which is why I expected the very near term action to enter the gap down created last Friday. The 15 min chart represents a longer trend and that is one of a pullback on a larger scale.

As of this a.m., we have seen movement in to the gap, it has not been filled, I have no way of telling whether it would be filled or not, I just expected a very near term move higher in to the gap.

As the SPY has entered the gap, I expected to see the short term intraday charts deteriorate, indicating selling in to that strength, we are well on the way thus far. The DIA which along with the SPY had the best looking short term intraday 3C charts, looks very much like the SPY charts below, in some cases such as the 5 min chart, the DIA looks worse.

 SPY 1 min negative on the open and moved lower from that divergence.

 You can see the leading positive divergence on the 2 min chart which is why I suspected a move higher in to the gap and a negative divergence on the open this a.m.

 The same is true of the 3 min chart

 The 5 min chart still shows the positive divergence, at least for the SPY, I'll keep an eye on this as it could mean the SPY is not finished working in the gap, but more likely is that the migration of negative divergences in the shorter timeframes simply hasn't made their way to the 5 min chart yet.

The longer term trend of the 15 min chart with a leading negative divergence is why I suspect a solid pullback in the market.

Overnight and In to the Open-Short Term Expectations Met

Overnight we start with Chinese imports/exports which came in below consensus and considerably lower than the previous. This has led to market talk that the PBoC may cut the Reserve Ratio Requirement (RRR) or may engage in some further easing as a result of the poor data with more data due out later this week, some think a RRR cut may be coming as a pre-emptive move before further weak data comes out this week.

Things turned around overnight with UK Industrial and Manufacturing Production both beating consensus. Sentiment is that the UK economy might not be as bad as thought as exports were healthy in the Trade balance.

In Germany the Constitutional Court is hearing arguments against the ESM and Fiscal pact, a decision on the ESM is not expected today, in fact there is talk from Market News that the judges proposed a 2 part decision, the first to be on the "injunction" which would come first and may not come for 3 weeks (the market earlier did not expect a decision from the court today, but seemed to expect a decision very soon). The second stage of the decision may not come until early 2013, which would address the constitutional question of the ESM and ultimately its ratification.


 "a delay could have “serious economic consequences” for the Eurozone as well as Germany, and in turn would risk placing the entire euro project “in question,” Schaeuble warned."

An injunction “will be interpreted by the foreign press as ‘euro-rescue is halted’” said Constitutional Court President Andreas Vosskuhle, during a hearing into the injunctions sought by opponents of European rescue fund.


“It is clear that this constitutional court cannot hold a full substantive, but rather a summary examination, given the tight time constraints” of the temporary injunction requests, Vosskuhle said. “That means that a final decision can not be taken in this hearing today about the constitutionality of the ESM, the Fiscal Pact and its accompanying laws.”


The ESM was originally scheduled to be online as of July 1st, however opponents within Germany have set that back...


"Opponents argue the ESM and Fiscal Compact will permanently curb the German parliament’s budgetary powers, and would therefore require a change of the constitution to be approved. They also argued an injunction would not be especially damaging, given the existence of the EFSF."


With little Tier 1 data in the US, much of the focus will be on Germany today.


Both Italian and Spanish 10-year yields were trading down, Spain below 7% apparently as a result of the EuroGroup reiterating the EFSF (temporary bailout mechanism) is able and willing to buy bonds in the secondary market (which would presumably lower yields-something the ECB's SMP program had been doing until it went quiet about 4 month ago). Again, this is known fact, it has just been reiterated and as such has had an effect on yields.

There was also an Economic Finance Ministers meeting in Europe today. Apparently there wasn't much in the way of new "news".

As for the US we saw the gap higher and in to Friday's gap lower as I have been expecting, gold also moved higher, apparently at least in some part due to F_E_D dovish talk.

From Reuters:

Three top Federal Reserve policymakers on Monday laid the groundwork for a third round of bond purchases, saying the U.S. recovery was weak and unemployment far too high.


"We are right at that edge, that if economic data keep coming in below our expectations -- and our view is we are not making progress on our mandates, or we don't expect to make progress on our mandates -- then I think we would need more accommodation," San Francisco Fed President John Williams told reporters after a speech in the resort area of Coeur D'Alene, Idaho.
But, underscoring the divisions at the U.S. central bank, Richmond Fed President Jeffrey Lacker reiterated his opposition to a new round of stimulus in an interview with Bloomberg Radio.
Speaking in Bangkok earlier, two of the Fed's most dovish policymakers were even more adamant.
"Additional monetary accommodation is needed to more quickly boost output to its full potential level," Chicago Federal Reserve Bank President Charles Evans told the Sasin Bangkok Forum. "The economic circumstances warrant extremely strong accommodation."
Addressing the same forum, the president of the Boston Federal Reserve, Eric Rosengren, backed that view, saying he saw slower growth and higher unemployment than most of his colleagues.
"So far data has been coming in weak and I gave a weak forecast myself," he told reporters after his speech. "I think it's appropriate to have more quantitative easing."

While on the topic of Central Bank action/Easing, we get this from the FT from Draghi of the ECB:

Draghi pledges further action if needed


The ECB president told the European Parliament that the central bank was “on a continuous search for actions that could attenuate the current crisis”.
“Within the limits of our mandate, we will do everything that is needed to improve the situation in the euro area from a price stability viewpoint,” Mr Draghi said.
The ECB president’s comments suggest further measures – such as more cuts to the benchmark rate, negative deposit rates and further sovereign bond purchases – cannot be ruled out.

As mentioned, there's not much in the way of Tier 1 economic data for the US today, we did see the NFIB Small Business Optimism Index 

Released On 7/10/2012 7:30:00 AM For Jun, 2012
PriorConsensusConsensus RangeActual
level94.4 92.0 91.5  to 93.5 91.4 

Although the miss from consensus doesn't seem that large, this index has been slowly moving higher and this is the largest drop in 2 years and also the lowest level since October of 2011. Whether this is a temporary blip (noise) or a reaction to Obamacare or something else, it is quite a change in character for the index in a very short period of time.

Crude has been elevated quite a bit above its normal FX correlation seemingly on event risk stemming from the Turkish/Syrian clash of recent, however some new data from China may also put the squeeze on oil as well as having broader economic implications.

"In June Chinese crude oil imports plunged from over 25 million metric tons to 21.72 MMTs, the lowest since December, or about 5.3 million barrels a day, down over 10% from the previous month's record import. While the number was still quite higher than the 19.7 million tons, the sudden drop is concerning, especially since the price of Brent slid materially in June, and if anything should have resulted in even more imports if indeed China was merely stockpiling crude for its new strategic reserve facilities. "

Tomorrow at 10:30 we have the EIA Petroleum Report as well.

Finally with all that has gone on overnight (I think the German Constitutional Court news has contributed significantly to volatility as the ESM may not be functional until 2013, which would most likely be far too late to help Spain and probably Italy), volatility has been high. Take a look at EUR/USD and ES.

 ES since yesterday's US close, the green arrow is the 3 a.m. EDT European open seeing a positive divergence in to the open.

 ES to present, the green arrow being the European open.

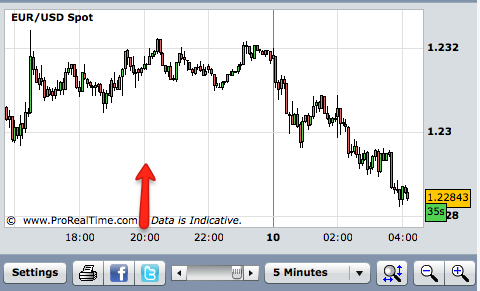
 EUR/USD since yesterday's 4 p.m. US close

EUR/USD since today's US 9:30 open.

Yesterday I proposed a theory regarding AA's short term positive divergences, the market entering the gap down and seeing a sell-off from there...
 In AA's case, the theory seems to have held water as AA has now sold off below yesterday's lows.

Whether it held water in the case of the market or not, our near term expectations have been met as the market has entered the gap area and started to retreat from it. It's still early trade and early trade is often deceptive trade, but o far short term expectations are on track.

Updates on the way...


EUR/USD - ES Update, EU downgrades and PFG the next major short trade?

Just as the shorter term Euro charts were showing in this post this afternoon, the Euro has lost ground since the close.


Also I mentioned ES and 3C as well as CONTEXT not looking as enthusiastic as ES in to AA's earnings...

3C is negative in to the after hours highs on AA's earnings and another negative divergence around 8 p.m. EDT.

We still have a long night ahead of us, but I'm curious to see if my guess about AA might hold up.

"Update from ZH

 " AA beats (headlines - at first glance though Adjusted EBITDA is half Q2 2011's) and is holding modest gains after-hours - though well of initial knee-jerk reaction highs"


I wonder if this might be a "sell the news event later as the devil is always in the details and may explain why the 1 and 3 min charts were positive today while 5 min, etc was negative.


In other words, the short term accumulation by market makers/specialists on the 1 and 3 minute timeframe would see those accumulated shares being sold in to after hours and as the devil in the details is discounted by the market, the 5 and 15 min negatives take over. This "could" also be enough to move the market in to the gap early tomorrow and if the AA story plays out something like I described, would provide some of the catalyst to finish up the short term divergences in the market that have suggested a move in to the gap before pulling back in a more serious fashion."


Oh and just for giggles, our favorite rating agency, Egan Jones, "the little train that could", downgraded the Netherlands to A; as a reminder the Netherlands were 1 of 4 remaining EU countries with the best rating of AAA, no longer though at least in Egan Jones view. Now let see what the other 3 majors do.

Austria was also cut to A, both outlook negative.

As for the Netherlands, they were cut for the very same reasons they have been poo-pooing the ESM seniority status....

From EJ:


The Netherlands is among the European Union's top economies. However, the Netherlands has been shouldering the burdens of other EU countries and their banks via its exposure to the EFSF and indirectly via the ECB. The country's debt to GDP of 75% as of 2011 (expect near 82% for 2012) and a deficit to GDP of 4.7% is weak and is understated due to exposures to the EU periphery and the Netherland's financial institutions. 

Finally, PFG to be the next MF Global?

The 3C charts show something that looks like big, recent trouble. This may be a short worth looking in to.

PFG 15 min longer term chart shows a strong area of accumulation that should have led to a very nice uptrend, instead it looks like distribution set in very suddenly and very aggressively.
 A closer look reveals a 15 min divergence that is a lot worse than the market divergences, it seems someone knew something about PFG since May, luckily it looks to still be in decent shorting position, maybe we'll even get  nice tactical entry. More of PFG tomorrow.


Monday, July 9, 2012

Risk Asset Layout Update

 CONTEXT didn't look too excited either in to the AA AH run up.


 Commodities showing much better relative momentum than the SPX today,,,

 Longer term the confirmation troUble with commodities seems to finally be ending, this doesn't mean commods can't fall from here, but as long as they stay roughly in line with the SPX, the sub-intermediate uptrend can continue (AFTER A PULLBACK-AS THAT LOOKS TO BE THE NEXT SIGNIFICANT MOVE COMING).

 Commodities vs. the Euro intraday, you can see what commodities were following, albeit at a rate that is above the normal correlation. Tomorrow we may get some commodity short set ups as they look to be in the over-valued area now. I was hesitant today with GLD and USO, they didn't look quite ready, but tomorrow I think we have a good chance of picking up a few trades in the space.

 High Yield Credit is holding up-this too is supportive of a resumption of the sub-intermediate uptrend, so long as HY credit can maintain a rough correlation with the SPX in the days ahead.

 Longer term the first time HY credit fell out with the SPX, the SPX pulled back shortly thereafter. So far so good.

 High Yield Corp. Credit, a bit choppy today, but all in all, in good position longer term.

 The longer term view.

 Yields were roughly in line today, they close an hour earlier than stocks so we didn't get to see if they'd push up with the market during the last hour.

 Longer term this is one of the worrisome charts as the dislocation is pretty dramatic here and Yields are a good leading indicator, this gives you some idea of what a pullback "could" look like and why I have suspected this pullback will be more volatile than what we'd normally associate with a pullback, but that is totally in character with the market's behavior which has been a meat grinder for those chasing the market or trying to force trades on the market. The market sets the rules, we just try to use the proper tools for its mod.

 The $AUD still in line with the SPX, still supportive.

 Looking at the Euro/Dollar update from today, I'm thinking that this move in the Euro is being sold in to. If the Euro can lift a bit more, the SPX can probably get into Friday's gap area, so long as the current 3C readings continue on course, everything makes pretty good sense with selling expected in to any quick move higher in both the Euro and the market lading to our pullback.

 Longer term, another worrying signal as the Euro is very diconnected from the normal legacy arbitrage correlation, I'm surprised arbitrage traders have let this go on so long without taking advantage of it.

A for sector rotation, it looks pretty much like I would expect, given expectations. Financials, Energy, Basic Materials, Industrials and Tech are slowly leaking off as the market looks to be getting ready for that pullback while the flight to safety trades rotate in, Healthcare, Utilities, and Staples. Discretionary is the only risk on sector that seems to be holding its ground, although not in strong rotation.

3C is not as enthusiastic as ES in AH.

Could it be the AA theory is correct and we are seeing selling in to some price strength here?

AA earnings

Update from ZH

 " AA beats (headlines - at first glance though Adjusted EBITDA is half Q2 2011's) and is holding modest gains after-hours - though well of initial knee-jerk reaction highs"


I wonder if this might be a "sell the news event later as the devil is always in the details and may explain why the 1 and 3 min charts were positive today while 5 min, etc was negative.


In other words, the short term accumulation by market makers/specialists on the 1 and 3 minute timeframe would see those accumulated shares being sold in to after hours and as the devil in the details is discounted by the market, the 5 and 15 min negatives take over. This "could" also be enough to move the market in to the gap early tomorrow and if the AA story plays out something like I described, would provide some of the catalyst to finish up the short term divergences in the market that have suggested a move in to the gap before pulling back in a more serious fashion.ck 


A quick reminder of A charts of interest...


 AA 1 min positive I mentioned earlier and 3 min positive below...

 3 min

 The 5 and 15 min above and below.


"If" this scenario did play out, then it would be fairly likely that there was a last minute leak that more or less said AA's headline number will beat, there will be a knee-jerk pop, it will be sold in to by smart money as the devil/details come out.


That would be interesting, it still wouldn't be an earnings trade I would call out as it doesn't have the profit potential considering the earnings risk, but interesting.

Euro/$USD Update

You can pretty much use the Euro or $USD updates very much like a market update, you just have to understand that the market normally moves in a risk on mode with the Euro, a weak Euro generally means a weak market.

The $USD has an inverse relationship with the market and most commodities so a strong dollar or a positive divergence in the dollar suggests the market will head down, a weak dollar suggests the market and commodities will head up. Oil right now is a bit disconnected because of event risk and the market overall is a bit out of sync with the normal correlation, it's one of the things that's been bothering me as far as the market moving much higher from here.

The charts below have good correlation among each other and with their natural correlation with the market divergences that are in place and for the most part, confirm the different timeframe trend expectations I laid out in last night's "The Week Ahead" post


 Euro short term or intraday charts are seeing deterioration, this is generally considered a near term market negative.


 2 min


 3 min

  The 5 min chart is still holding a little positive divergence from Friday-the short term charts negative stance hasn't migrated this far yet.

 The 15 min chart is in line with price action. Being the SPY 15 min is negative, it is easily understandable as the market has not seen the same downside the Euro has, nor the downside we'd expect to see from the FX/Equity correlation, I think they will meet up as stocks pullback and revert to the normal FX/Equity correlation.

 Interestingly though, like the market's longer term charts in which I explained the various trends last night, we have an hour and 4 hour positive divergence, again suggesting after we see a pullback, we still have more upside to go before a primary down trend re-asserts itself.

 4 hour

$USD (via UUP)
 As we see deterioration in the Euro short term charts, we'd expect to see some positive movement in the $USD short term charts (as the signals should be the opposite for confirmation) and we see that here on the 1 min as the afternoon wore on.

We have some negative movement in the 3 min $USD, which is not too far off the positive Euro 5 min still in place

 The $USD 5 min is still negative, much like the Euro 5 min is still positive. Short term this still suggests the market is not quite done and perhaps we are still heading for the gap from Friday.

 The 15 min $USD is positive in line just as the 15 min Euro is negative in line. This again supports the negative 15 min divergences in the market, all 3 confirm each other (market divergences and Euro/Dollar divergences); they all still point to a decent pullback move, this is why I wasn't too worried about watching AAPL closely for the best entry, I think it's close enough for the time I have to devote to watching it.

Interestingly, the Euro 60 min and 4 hour positive is met with a similar 1/4 hour negative in the $USD, which also matches the market divergences, so all in all, we have pretty good confirmation of the different trends I laid out in last night's post.