Monday, July 23, 2012

BPZ Follow Up

Here are the short and longer term charts for BPZ.

 BPZ from a descending wedge to a very predictable up channel, today looks like a shakeout of longs below support. I like the increasing volume, I'd like to see a "Hammer" candlestick form, that would give us a much higher probability reversal to the upside.

 The BPZ intraday 1 min chart, no downside confirmation.

 The 5 min chart showing exactly where that predictable up channel was, it's not surprising it was shaken out and 3C shows the negative divergence in the channel and that is was coming, it's also showing a leading positive divergence at this move today.

 BPZ 30 min trend looks pretty clear, from negative and a downtrend to a positive during what has been largely lateral or base-like trade.

The 4 hour chart goes from up trend confirmation to a negative divergence at the high, a down trend, followed by a leading positive divergence. I like the probabilities for BPZ, I still want to keep most long positions on the speculative side.

Adding a Small BPZ position (Equity Long)

This is an add to position, it's still in the speculative range.

UNG Update

I've had some questions about adding to UNG as it is above a serious resistance level and would seem to have broken out. The fact is, only stage 2 mark up is going to move UNG higher, that will take retail getting excited, volume flowing in, traders chasing UNG and right now I don't think sentiment in the market generally is focused on that task. I still love UNG and am still holding it as a core long position for the longer term at a decent 24.5% profit.

 UNG change in character

 UNG apparent base pattern

 1 min intraday chart

 3 min intraday.

 The 15 min chart has improved a lot recently going from negative to a positive divergence to an in line stance with price or confirmation.

The longer term hourly chart is still looking quite impressive, suggesting UNG is still in a stage 1 base, stage 2 mark up is where most of the gains would be found.

BIDU

I still have a bit smaller than speculative Aug $110 Call position open in BIDU, they report today after the bell. While my longer term view on BIDU is bearish and I hold a core short that is up over +26%, I still think BIDU has a good chance at a counter trend move up, I can't say that it is earnings related, it seems to be something perhaps bigger than that.

 The yellow box is the area in which we let the BIDU short come to us, that trade has been open since then, however the recent move below a descending triangle looks like a bear trap set up for a counter trend move up, I still believe the primary trend in BIDU will remain down and intend to hold the core short, but the counter trend move I think has enough promise to be worth playing at least on a speculative basis.

 The 1 min chart signaling a pullback for BIDU, if we were to get a little more price weakness with 3C strength, I might be inclined to add to the BIDU position, although the 3C charts would have to be very strong going in to earnings today.


 Close up of the 1 min chart intraday.

 The 2 min chart is also showing a positive signal.

 As is the 3 min chart so there's some migration through the timeframes which I like, I'm just now convinced it's enough to add to the position.


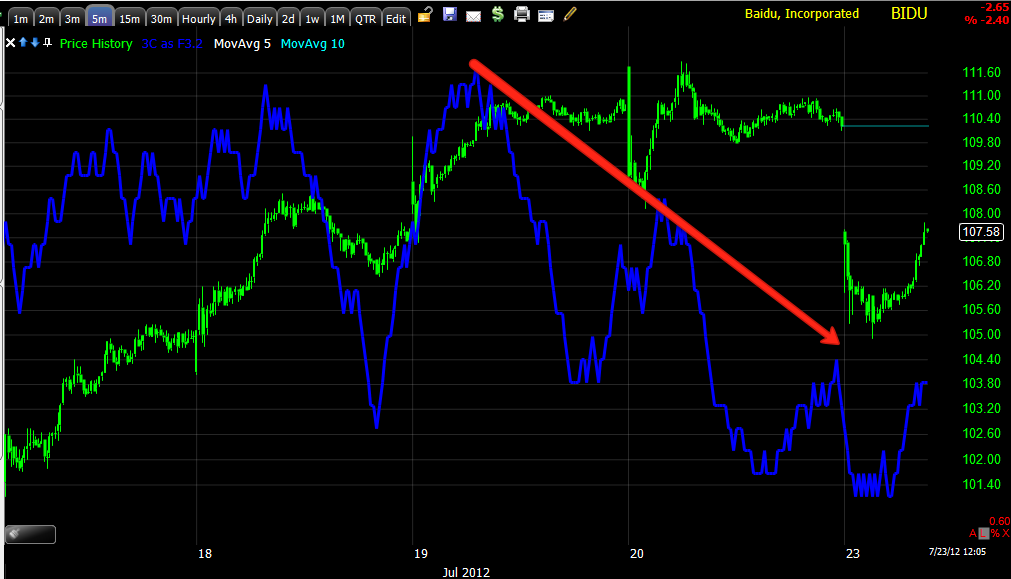
 5 min chart suggesting a pullback was pretty high probability.

 This 15 min chart has an overall positive character and trend to it, but it's also fairly large, it's not the typical earnings "leak" signal, unless something has been known for a very long time, this seems more of a counter trend move with  company that surprises to the upside more often than not.

This is kind of a map of the sub-intermediate trend in BIDU, you can see the negative divergence where we originally went short with that position still open at a nice profit and where BIDU looks pretty positive here for a counter trend move up, perhaps enough to even add to the core short (4 hour chart).

NFLX Trade Set Up

NFLX was mentioned several times last week, this looks like  trade that could play right in to our waiting hands.

Here's the updated charts for NFLX...
 There's a daily gap in NFLX and it's right around the Trend Channel which is set to a 50 day "character setting" rather than the shorter 11 day, this is around the area I'm hoping to catch NFLX with some positive divergences for the next trend which if you recall in our trend expectations, after a sharp pullback, I'm looking for a sharp move higher, perhaps a short squeeze even, but more on that in a minute.


 The 1 min trend finally signaled NFLX was ready to move down from this plateau it has been trading on.

 The divergence on the 30 min chart is quite clear, not much noise so this tells us the path of highest probabilities is down, but not in a destructive way, rather a constructive way, this is why we'll be watching for signs of accumulation on a pullback.

 The 60 min chart which is more important that the 30 min shows what may in fact be a fairly large (for this market ) double bottom with a leading positive divergence on the second bottom which is a common occurrence for this pattern.

 The 4 hour chart which is even more important shows the same pattern with less noise, this is why I want to look in to buying NFLX on price weakness which should roughly fit the timing of the next "expected" trend, from what we see now.

 As for volatility, if it were me running the show and trying to shake out and set up as many traders as I could, I'd be heading back in side the large bear flag on the SPY seen above, this would make shorts think twice and probably see some cover, then another move lower could be set up.

If something like that happens, NFLX would be likely to fill this gap in yellow, so for now I'd consider this noise, but keep watching for that move lower in to underlying strength. With the size of the potential base, it should be able to sustain an impressive move up and the entry would be at much lower risk and higher probabilities.

Market Update

Hopefully this update will show you the trend of underlying trade vs the intraday movements, it's not much different than a price trend, the main trend is what is most important, however nothing moves straight up or down so the counter trend moves (intraday moves) are useful as entry/exit points, just keep in mind the scale of each (trend vs counter trend).

Here are the 3 major averages...
 You already saw the 1 min SPY, the 1 min DIA looks similar, keep in mind though that the longer the timeframe, the more important the signal, 1 in is useful for intraday signals and when there's a trend can be useful for signals a little longer, especially if longer timeframe charts are confirming, but a 2, 3 or 5 min chart has much more power than a 1 min chart; just as a 30 and 60 min chart are more powerful than the key 15 min chart.

 DIA 5 min trend, this is part of the reason we have been looking for the next trend to be down for a couple of weeks now, yet notice there is an intraday positive today, it doesn't compare to the trend, but it can still move the market in ways that can be useful to you.

 A close up of the last several days of the 5 min chart and today specifically, this is why I wanted to close half of the UVXY $9 Calls at the profit they were at.

 The 15 min chart's trend is much more negative in the DIA, yet it even shows some small signs of a positive divergence intraday today, thus my longer term shorts stay in place, the leveraged shorts that will move around a lot on an intraday basis, I want to try to trade around those. All Core shorts stay in place.

 QQQ 1 min trend is overall deeply leading negative, yet we have a relative positive divergence intraday today

 A closer look at the 1 min intraday relative positive divergence and the QQQ responding.

 The 3 min trend makes pretty clear why we were expecting the next trend in the market to be down, yet again we have intraday positives. If we can get enough price strength, I want to sell in to the short term positive and trade with the longer term negative trend.

 A close up of the same chart as above, just looking at the last two days and the positive this morning. I rarely trust a.m. trade.

 QQQ 5 min trend is horrible as it makes a double top

 The SPY 1 min you already saw zoomed in

 The 3 min trend, leading negative, but with an intraday positive divergence.

Here's a closer view of the same chart as above. You know what the 15 min SPY chart looks like.


Why I want to sell Strength in 2 charts

 This intraday 1 min SPY and even out to 5 min looks like the early a.m. action is about to give way to some upside, I want to look to sell in to price strength because this is the overall near term trend we have been talking about below...

SPY 15 min negative.

With leveraged options positions I want to be more nimble, with straight out shorts like IOC I am more than willing to hold those.

CLOSING HALF OF AUG $9 UVXY CALL

AUG $9 are at a decent profit, the Aug $6 were closed Friday as I was hoping for a better price point, I'll still be looking for a new entry, but early trade is often deceptive and there's a nice profit in these.

Non-leveraged positions such as FAZ (other than the leverage built in to the ETF as the position is a straight equity long) will remain in place. FAZ is up +11.55%

In to the new week

Or in to the abyss? ES and futures certainly feel that way. Last night I knew the worst of it was not over after watching the weekend news develop from Europe, I wouldn't be surprised if at least some of this news was already well known and being discounted last week. Remember we've expected a decent pullback for a couple of weeks so these are only short term charts registering the underlying selling from last week only that were suggesting the move down or what I've been calling the next trend (thus some of our short positions like FAZ and longs like UVXY)...
 DIA longer term were already negative, short term negative nearly all week

 QQQ leading negative most of the week

SPY short term trend leading negative nearly all week.

Wouldn't you know it, the sentiment report from last Friday said retail was expecting a bounce in the S&P to $1390 this week, NEVER SHOW WALL STREET YOUR CARDS.

Here was the bad news just as of last night, this is why I knew things would get worse once Europe opened...


SCANDAL AT IMF with chief economist of 20 years saying he is ashamed to have had anything to do with the organization in his resignation letter...

As a distraction perhaps? The IMF decides to cut Greece lose. In a Speigel article...
Senior IMF officials patience has clearly come to an end and has decided that, with Greece likely to go bust by September, it is no longer willing to provide additional Greek aid

Which seems to be fine with Anti-Bailout party leader, Tsipras of Syriza, in Athens News the leader of the anti-bailout party that forced Greece in to a second election is forecasting that the government will "soon present a return to a national currency (drachma) as a national success."

He went on to state rather honestly for a politician, that any payment extension (of the already re-negotiated TROIKA deal) is "essentially a longer rope with which to hang ourselves.", he notes the Greek finance minister is the definition of a finance minister that the TROIKA would have chosen.

You'll get no argument from Germany's Roesler; from the AP...

"The German vice-chancellor has a "More than skeptical" view that Greece can fulfill its obligations; after which "There can be no further payments", adding,  Roesler said he was "very skeptical" that Greece can be rescued.

Adding fuel to the fire,  Germany's Roesler continued, "for many experts,... a Greek exit from the eurozone has long since lost its horror." We've seen what the EU experts are capable of, it's not very comforting.

Greece must pay its next round of bond redemptions on August 20, and with the over the weekend announcement that the IMF stated they are suspending Greece's future aid tranches due to lack of reform, August 20 might be the most important day of the entire summer and very well could turn into the credit event that breaks the camel's back-all back to where it started-sort of...

Spain is the LAST DOMINO...


That wasn't it for the fireworks, after a horrendous European close Friday (perhaps the 3C intraday positives were in fact scenario 1, just support to hold the market in an op-ex pin position as the flow of fundamentals was clearly more negative than we could have imagined)  and the region of Spain's Valencia said they'd need a bailout, 4 more regions in Spain are seeking bailout help brining the total to 6.

Remember when the 2.5 hour EU Fin Min teleconference came out with their Bazooka to calm the markets pledging $100 bn euros to Spain's banking system and we said back then, that day in fact that the bailout mechanism would subordinate sovereign debt holders and send Spain from a banking sector bailout to a full national sovereign bailout as their 10 year yields went through the sky? Remember that? That is EXACTLY what is happening. Spanish 10 year yields trading at a new all time high at 7.565%


Liborgate...

This one is just getting worse and worse, engulfing the entire financial system including regulators as banks, all of which should have ended up as bailed out utilities in the aftermath of the Lehman collapse, will now be forced to fork over billions in cash to the same governments and administrations that bailed them out in the first place, under the guise of civil and criminal penalties in what will almost certainly end up as the biggest financial settlement in history, one which will leave most of the world's banks sorely undercapitalized and force the Basel implementation of various capital requirements to be scrapped indefinitely.

If you're not sure what the Libor Scandal is all about, check this link. I think my favorite part is this,


In a July 14 editorial in the Guardian, Naomi Wolf suggests that only a short time ago the "notion that the entire global financial system is riddled with systemic fraud – and that key players in the gatekeeper roles, both in finance and in government, including regulatory bodies, know it and choose to quietly sustain this reality – is one that would have only recently seemed like the frenzied hypothesis of tinhat-wearers". Looking at the fact that Tim Geithner went on to be promoted to Treasury Secretary. Wolf commented, "It is very hard, looking at the elaborate edifices of fraud that are emerging across the financial system, to ignore the possibility that this kind of silence – "the willingness to not rock the boat" – is simply rewarded by promotion to ever higher positions, ever greater authority. If you learn that rate-rigging and regulatory failures are systemic, but stay quiet, well, perhaps you have shown that you are genuinely reliable and deserve membership of the club."

Since last night's barrage of bad to worse news, we can add the following...

In what we first covered last week from an Italian member of ours, 10 Italian cities, including Naples and Palermo are also seeking state aid, however, as we first noted on the release of the news of the $100 bn for the Spanish Banking sector, the real concern is that Spain has moved from needing a banking sector bailout to a full blown sovereign bailout, and to think we could see this as soon as the Fin Min Teleconference decision had been announced, how could they have not seen it? They actually thought they'd be hitting the market with a Bazooka! Italian 10 year yields are rising, don't be surprised to see them at 7% soon.

Because it worked so great last time (SARC.), Italian financial regulators are re-introducing a Financial "Short Selling Ban". This ban is set to last a week, last time it actually seemed to do more damage and create more panic than any good.

Shortly thereafter Spain instituted its own short selling ban, but not just on Financial stocks, but market wide, this one could be extended up to 3 months!!! The Spanish stock market is now down 12% over the last 2 days.

Have I mentioned recently that the next trend we should be looking for is a move down, a pullback, but more aggressive than what we'd normally consider a reasonable pullback?

Market updates coming, news is just fast and furious.


From Really Bad to Worse

Over the last week, we've had a strong signal that the next trends was going to be a pullback and many times I described it as something more severe than what we would normally associate with a pullback.

Over the weekend and last night I watched the news particularly out of Europe go from bad to really bad to even worse, but there isn't much that has occurred that we didn't already clearly see and predict (coming in another post).

As for the market...
 ES is making new lows faster then they can be captured, currently at 1339.00

EUR/USD is at new lows.

The SPY looks set to open down a full 2 points.