I still have a bit smaller than speculative Aug $110 Call position open in BIDU, they report today after the bell. While my longer term view on BIDU is bearish and I hold a core short that is up over +26%, I still think BIDU has a good chance at a counter trend move up, I can't say that it is earnings related, it seems to be something perhaps bigger than that.
The yellow box is the area in which we let the BIDU short come to us, that trade has been open since then, however the recent move below a descending triangle looks like a bear trap set up for a counter trend move up, I still believe the primary trend in BIDU will remain down and intend to hold the core short, but the counter trend move I think has enough promise to be worth playing at least on a speculative basis.
The 1 min chart signaling a pullback for BIDU, if we were to get a little more price weakness with 3C strength, I might be inclined to add to the BIDU position, although the 3C charts would have to be very strong going in to earnings today.
Close up of the 1 min chart intraday.
The 2 min chart is also showing a positive signal.
As is the 3 min chart so there's some migration through the timeframes which I like, I'm just now convinced it's enough to add to the position.

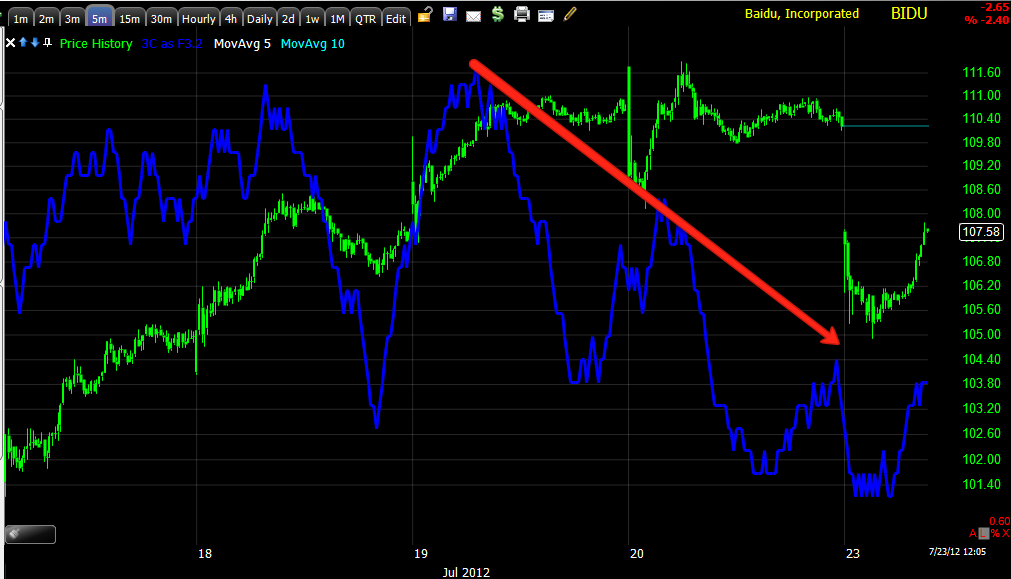
5 min chart suggesting a pullback was pretty high probability.
This 15 min chart has an overall positive character and trend to it, but it's also fairly large, it's not the typical earnings "leak" signal, unless something has been known for a very long time, this seems more of a counter trend move with company that surprises to the upside more often than not.
This is kind of a map of the sub-intermediate trend in BIDU, you can see the negative divergence where we originally went short with that position still open at a nice profit and where BIDU looks pretty positive here for a counter trend move up, perhaps enough to even add to the core short (4 hour chart).


 | Theme by Thur
No comments:
Post a Comment