Friday, August 24, 2012

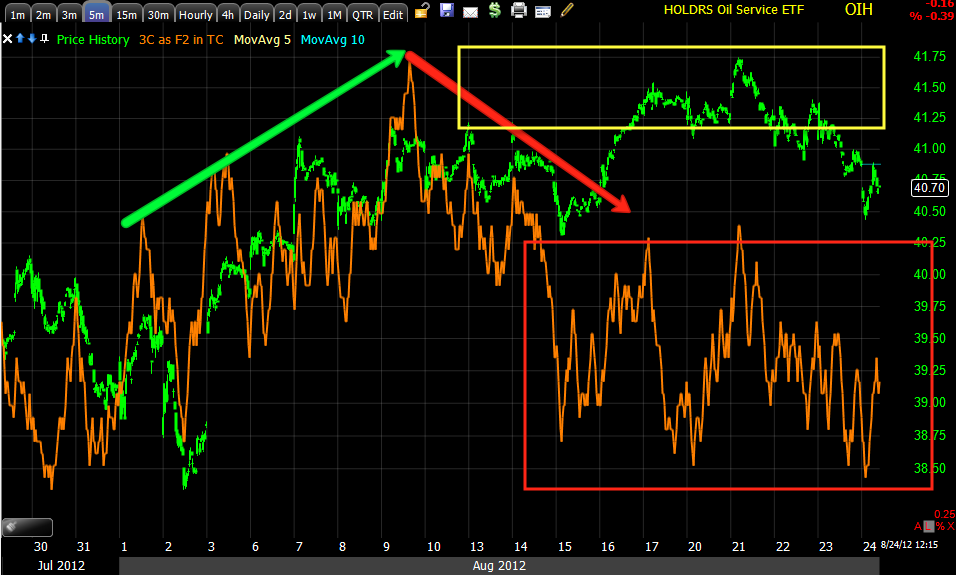
OIH-Short Idea

I have a lot of exposure to Energy on the short side so this isn't a trade for me, but if I wanted exposure to the sector without stock specific risk (there are ETF risks too), then the oil services looks to be an area of interest.

I personally would prefer a short position here rather than a put, just because of the lack of a clear set up right now and a more general overall negative tone that I think may be longer lasting.

 The daily chart and a gap that OIH crossed, this may be the area bulls were looking for a breakout move, meaning this may be a decent size bull trap, so the trade is by no means too late.

 Using the daily trend chanel that held the entire move up, the break in the trend for OIH is a close below $40.45 and if I were short on a swing trade, the stop would be $41.45, it would be wider for a longer term trade and I prefer wider stops with fewer shares.

 From the macro to the micro, the 4 hour chart shows a significant leading move down at the rcent top, this would be the distribution seen in a head fake move. I don't recall recently seeing any 4 hour charts with this extreme of a leading negative divergence.

 The 60 min chart went VERY negative in the same area, the head fake/bull trap area.

 Same with the 30 min

 and 15 min, this overall looks to be a sound trade strategically.

 Look at the detail the 5 min provides, as soon as we move in to a head fake area, distribution

 Now the shorter term charts and why I would look at this as a position that maybe you phase in to and why I prefer options, you may get a bounce and be able to add at better prices, but right now it is in line and there's no signals for a bounce. It's kind of take it or leave it.

 2 min chart is the same

A is the 3 min.

Remember it hasn't broken below the head fake area yet, that's where the momentum to the downside will be, so it's still in a decent overall position, but not one that I find appealing for an options trade unless you have a long term horizon.

Market Update

It looks like that trendline I told you everyone was going to be watching is probably going to be gamed a bit, it looks like near term volatility, but as I tried to imply earlier, a move above the trend line was more likely and there are still good signals that the probabilities lie there short term and it still is an environment in which I want to short in to, BUT with patience , the right set ups and the right signals, I'm not feeling rushed to get in quick, I'm feeling rushed to get a lot of ideas out to you.

 DIA as was easily predictable, above the trendline, but that provides an area for some intraday stop and limit order fishing. The 1 min chart still seems to suggest even as we see higher prices, the theme is selling in to them as the window of opportunity seems to be shutting fast.

 2 min chart has seen the 1 min chart's weakness migrate over, this is the selling in to strength, but by large institutions (also shorting) with large orders so they could be at this a while longer.

 The accrued strength of the positive divergences over the last 2 days and today that I have been talking about, as sloppy as they have been.

 And the 5 min chart, both suggest there's still upside room, remember there's no rally or counter trend move as fierce as a bear market rally/ bounce, so I'm inclined toward patience and taking the trades where the opportunities are when they are there.

 QQQ 1 min also seeing near term weakness.

 2 min seeing worse weakness as the 2 min is in a leading negative divergence.

 5 min is in line. This may mean tech is not as strong as we might assume.

 SPY 1 min also seeing weakness above the trendline.

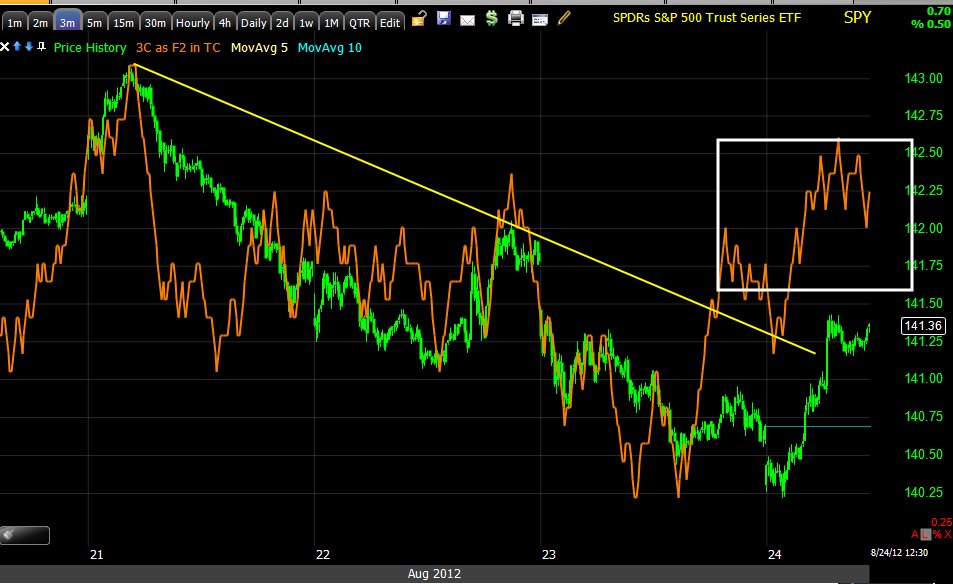
 3 min is still positive, suggests there's still more upside even though there will probably be near term volatility as most traders focus on that trendline.

5 min chart is in line, perhaps financials are not as strong as we might think as well.

ES Update

I'll have to verify this with the market averages, but it looks pretty reasonable to me at the top of the daily VWAP, the weekly is pretty ambitious.

By the way, next up is OIH as a short, it looks pretty good right in here.

 ES leading negative

At the top of the standard deviation VWAP channel, nice place to sell.

GLD Charts and Position

I'm opening a September GLD $160 Put at a speculative size as I'm OTM on this which is something a little different for me.

Santelli says Gold is no longer acting as a QE probability indicator, but rather just the opposite, I'm not convinced at all, I think it may be more of a technical / psychological /Wall St. thing than anything, but I don't ignore signals like this so I added to 2 put positions already in place (Sept $157/$160).


Here are the charts, I'm not going to comment much because I don't think they need much commentary.
 Rather than Santelli's opinion, this break above a clear resistance zone on what is increasingly lower odds of QE now that it has been politicized, makes more sense technically/psychologically and just the way Wall St. does things.

 1 min


 2 min but not scaled quite right, you'll see, but the important thing is the change at the breakout.

 2 min locally

 3 min has enough history to scale properly, the 2 min should be scaled more like this, just doesn't have enough history, note the same change at the breakout. That would suggest a pretty decent size institutional short in place.

 3 min locally

 5 min-are you seeing a pattern here at the exact same spot?

 5 min locally...

 15 min with fast deterioration

30 min with very fast deterioration.

 30 min trend

60 min trend at a relative price divergence, this would be deeply leading negative on the most important timeframe before a daily.

AAPL-Think Triangle

I mentioned AAPL and its triangle and the possibility of a Crazy Ivan shakeout, it looks like that' what we have.

Be patient on AAPL, no need to jump right in to shorts, same with BIDU and others, let the trade and the signals come to you, I'll bring them to you.

A move to the upside above the triangle and we'll likely have a Crazy Ivan shakeout, but again, consider the bigger picture theory I laid out this morning, don't rush it.

This maybe your chance in GLD

Charts on the way, they don't look good. I already have a short there or Puts rather, may add to them, I'll let you know if I do.

Market Update

This seems to be making a little more sense now, often we see things that are being executed way before we know why, as a matter of act, we may be out of the trade before we know why or we may never know why. Let me just say, I'm very much okay with the fact I exited BIDU PUTS yesterday for a nice gain, they'd be worth a whole lot less today so I follow the signals.

Many of you know I had the useless pleasure of seeing a major Wall Street firms research papers for the trading desk, I thought I had a goldmine, but nothing that was in those papers led to any profitable trades until I looked at the papers 6 months later, then things fit. That should give you some idea of how far in advance Wall Street often plans, or if you've seen my charts of the homebuilders under massive accumulation during the 2000 Tech meltdown, who would have thought after the tech revolution the next bull market would be led by housing? Wall Street knew and about 2-3 years in advance.

So take a look at the near term.

 First the Euro is at about the same levels as it was at 8:30 this morning.

 So this move in ES that had a positive divergence in pre-market has nothing to do with legacy arbitrage correlation. Keep in mind the VWAP charts of ES posted, VWAP is where they'd like to sell, but as the door closes there will be more and more trying to fit through a very small space unless they can keep that door open wide enough, long enough, which looks to be an opportunity for us.

 The DIA 3 min, as mentioned, divergences can accrue and we have now at least a 1-day solid positive divergence on the 3 min chart, not a huge divergence, not an extraordinary timeframe, nothing compared to the negative divergence at the head fake top, but enough to provide us with opportunity? I think so. The trend line is what EVERYONE is watching so it's useless, you have to see what the crowd misses, but a move above the trendline may kick start some natural retail buying, the VIX ix no where near fear yet.


 As for the very short term 1 min, it seems this move is not only not confirmed, but appears to be seeing selling in to it, not extra strong selling, but selling.

 The QQQ 3 min divergence (positive) is a mess, not organized well, but it is still a positive divergence.

 As far as selling in to strength, shorting strength, this is how and why the core short positions have been so successful, we didn't chase, we let the trade come to us on our terms and we did what emotionally no trader likes doing naturally and sold short in to price strength, but we had the signals there to give us a reason and confidence.

YOUR GREATEST ADVANTAGE OVER WALL STREET IS PATIENCE, YOU DON'T HAVE TO BE IN THE MARKET ALL OF THE TIME, YOU CAN PICK AND CHOSE YOUR BATTLES.

 THE SPY 3 min positive divergence

As far as selling in to strength, I want to see the 3 min go negative, but I have no problem with it as this 30 min timeframe is 100 times more important than a 3 min timeframe and it is ugly as can be.

We just have to keep an eye out now on our theory and look for the opportunities. We've only had about 3 really good opportunities to set up larger, longer trades this year, this looks to be a 4th.

ES & VWAP

We'll take a closer look at the averages and see if there's anything to these charts, but as you know the last couple of days we've had some weak positive divergences that haven't done much. As mentioned earlier, you can't separate hedge fund redemptions with 89% underperforming the S&P and the effect they'll have on the market, especially when a big shot like Paulson loses the confidence of CITIGROUP.

The VWAP has long been used as a measure of how well a market maker or specialist can fill an institutional order, if they can fill it near the VWAP then they did a good job, if they are accumulating and can fill below the VWAP they did a great job, if they are selling and average below the VWAP they aren't likely to get more business from that institution. So I thought we'd take a look at ES, 3C and VWAP.

 3C/Es 1 min on the open, a minor positive divergences at ES's low pre-market.

 The daily VWAP acting as resistance as if there were sellers every time ES reached VWAP.

 The Weekly VWAP on an hourly chart, note where Es is in relation to VWAP, note where it has been as ES has turned over.

 Here's a closer look.

The ES/3C 5 min chart. there's a small leading positive divergence in ES here, enough to get up to the weekly VWAP? We'll have to see what's going on in other assets first, but this is another reason why I would consider selling/shorting in to strength to be a reasonable plan of action.


Over night and other news and in to the open

First lets start with hedge funds and Paulson's in particular. Only 11% of hedge funds are outperforming the SPX right now, that makes it a whole lot cheaper to buy an SPX linked fund from Vanguard or whoever than pay 1.5-3% management fees and 20-50% performance fees. What does this all add up to? Redemptions and selling positions to cover the redemptions.

Paulson's main 2 funds are being hit with redemptions from CITIGROUP as was reported yesterday, what is Paulson's best performing and maybe only performing position? GLD, so when the time comes, which may be now, GLD will be sold to cover the redemptions , which at this point is reported to be at least $500 mm from CITI alone; forget the other 89% of underperforming funds.

As for the market, it seems the downside moves are getting a bit larger than average, volume is picking up, these are all signs of a head fake move, except when it really confirms the moves and volume will be notably bigger, look at BIDU as an example. I don't think you can separate hedge fund performance and the what will come out of that from the market action now, better for them to sell up here now in anticipation of redemptions next month than at lower prices when there may be no demand a mont from now.

I told you early in the week, someone is betting on volatility to rise and rise it is, the VIX has seen its biggest 3 day gain in a month after just making a 5 year closing low. ES (S&P E-mini Futures) also dropped the most in a month and on volume, something that has been missing lately.

Overnight the fact that Greece is in trouble again is bothersome given how many bailouts and plans have been made and how quickly everything has fallen apart, but the market uncertainty of how this ends is causing deeper panic as markets hate uncertainty and while it seemed for a bit that there would be some concessions made or at least talk of them, a top MP from Merkel's party said overnight that the Greek deal can't be renegotiated and the Euro would survive without Greece, which would mean the current Greek deal is effectively worthless as they are in a deeper hole than the deal encompasses and they got there in record time, by the time a new deal is agreed to they'd be even deeper needing another new deal, that's what austerity does to an already dead economy that has no way to control its own currency. Remember Samaras is visiting Merkel today and expected to ask for more time to meet the financial deadlines that they have missed so badly, possibly up to 2 years, so a higher up in Merkel's party making those comment today doesn't bode well for Greece.

The German Finance Ministry is also said to be studying the costs of a Greek exit, trust me they'll be huge as Greece will stiff everyone, they'll have no choice, maybe the IMF would escape unharmed, but the banks, ECB, Germany, they all will get zilch. It's almost like Greek Bond-Holders revenge. Several notable and not so notable countries are backing the idea of a Greek exit, the Euro and ES didn't care for this talk, see what happens when Merkel is on vacation and when she comes back?

As for Spain, rumors yesterday that Spain would seek a full sovereign bailout from the EU have been sort of denied as the EU says today that they have received no formal request. We predicted this the day the EU Finance Ministers okayed a $100 bn Euro Bazooka bailout for the Spanish banking sector, we said that this would lead to a full scale sovereign default, not just a banking default because the banking bailout would contain terms that made the EU loan senior to all Spanish bond-holders, soon after that the Spanish bonds broke above 7% which is unsustainable and keeps them from going to market, and this happened for the EXACT reason we predicted that very same day!

Remember all of the excitement caused by Draghi's TALK, but then when it came to the meeting he punted on bond buying, well get ready for more deflation of the balloon of excitement that the ECB may actually do something soon. As Bloomberg reported, the ECB will wait until the German Constitutional Court rules on the ESM before making a decision about the bond buying, if you were paying attention last week, you'll know there were two more suits brought against the validity of the ESM that will likely delay the German Court's ruling even longer, so the ECB excitement over bond caps may have just been shot down as well.

In the US, we saw Durable Goods at 8:30 am

Released On 8/24/2012 8:30:00 AM For Jul, 2012
PriorConsensusConsensus RangeActual
New Orders - M/M change1.6 %1.9 %-1.0 % to 7.0 %4.2 %
Ex-transportation - M/M-1.1 %0.4 %-0.8 % to 1.0 %-0.4 %

The headline number was a solid beat, remove transports and defense spending and things got much darker, but few look behind the headlines. Ex transports DG was down -.4 on consensus of +.5, with June revised down from -1.1 to -2.2. Nondefense capital goods excluding aircraft crashed in July to -3.4%,  below consensus of a -0.2% print, with the previous print revised from -1.4% to -2.7%.
This report is the epitome of a pig in lipstick.

Here's The EUR/USD and ES overnight.

 The Euro since yesterday's 4 p.m. close


ES including Wed/Thursday night, Thursday regular hours and overnight in to the open.

However in my opinion, the more worrisome charts for the market are the $AUD pairs.

 AUD/USD

AUD/JPY

With the carry trade off, the risk trade is off.

Opening indications coming next.