Tuesday, September 18, 2012

FB Follow Up

In yesterday's FB update (I know a lot of you have different positions there) I showed the most probable near term outcome was a constructive pullback.

FB is up a bit today, but it hasn't seen any underlying changes that would alter the analysis from yesterday, nor is there any price action that would alter the trends in place.

Here's an update of the charts as well as two potential stops for either a swing type trde and maybe an options trade.
1 min chart with yesterday's open still a likely head fake reversal pivot.


 1 min chart intraday is starting to break off with FB's price.

 The 3 min chart is the only place I can find a positive divergence for today's move higher off a triangle price consolidation this morning, this chart is now putting in a relative negative position.

 The 5 min chart is leading negative at the probable head fake move on yesterday's open, the price/3C action is just 3C moving in line with price on an intraday basis.

 The 15 min appears to have a relative positive divergence at the two white arrows, it doesn't. Price is higher at the second arrow and basic confirmation would mean 3C would have to make a higher low at the second low to even be in line, much less positive, the leading negative at the yellow breakout area is clearly negative.

 The 30 min chart that was in near perfect confirmation on the move up is relative and then leading negative.

 Even the 60 min which has shown perfect confirmation is for the first time since August, negative.

 The X-over screen is advancing well, the highest probability pullback is still around the yellow 10-day m.a.


For a swing type stop, the daily Trend Channel is at the $19.75 area, which should lock in a profit, for a tighter stop...

The area would be around $21.50, if FB moves higher intraday this channel will continue to lock in gains and the stop will be higher.

GLD

GLD is a bit tough to read right now, it looks similar to the market update I just put out in a number of ways, however there are some unresolved divergences that GLD is in the middle of.

I would say the highest probabilities are for a short term move up, unlike the major averages that have a pretty good picture of the bigger picture (as much as you can get from 3 days trade), GLD is not so clear in that respect.

The Gold mini futures actually gave an excellent signal on the 1 min chart that has been too spotty, but a strong signal will pop through that. Gold was in line with 3C, not showing anything interesting until it went deeply negative and gold followed, however this is only a 1 min chart, that move to bring gold prices down can be used to accumulate a position at cheaper prices and with more supply available as sellers enter the market on the move down.

 The GLD chart at 1 min shows the positive divergence, especially in to the afternoon yesterday and GLD has moved up, note the drop in price and the 3C positive divergence to the far right.


The 5 min chart shows a negative divergence, price falls slowly from there, it looks like some smaller positives at extreme lows. I'm interested in whether this 5 min chart's 3C turns up validating a positive divergence here or whether it moves lower.

It seems by the intraday action, at least a short term move up is in the works, after 5 mins in GLD it gets very inconsistent with the 10 min chart looking extremely negative, the 15 min chart looking fairly positive, the 30 min inconclusive and 60 negative.

So back to the futures to see what they offer...
 Gold (YG) 15 min is a perfect example of a stand-off, the negative divergence while price is flat send price down (red arrow on price), the equal size positive divergence while price is flat at the lows sends price up to almost the exact same point, so two divergences of roughly equal size producing roughly equal moves, that doesn't give us a lot of information, but it may explain something...

 The 30 min gold (YG) chart does the exact same thing, leading negative at a flat area in price with price following the negative divergence lower, then a positive divergence at the flat area of the lows and price responds by moving back up, it's difficult to say whether the positive divergence is more important or not.

At the 60 min chart the action is negative on the chart, so again we are kind of stuck with the only signals sticking out are some positives on short term timeframes, even the futures are not giving us a clue in the intermediate to longer timeframes, which may explain why the GLD charts are so screwy in those same timeframes.

Oh and by the way, that 5 min GLD chart which had a question mark as to whether it would put in a positive divergence or not, did not.


Market Update

To me it looks like we will see a short term move up soon likely followed by a larger move to the downside or a new low. Price has been moving down the last few days in a very linear way, not the norm for the market in which you have waves, even in a downtrend, I suspect a move to the upside will form one of those waves.

We'll take a look at GLD next.

Here's a look at the other averages and what ES looked like when the DIA had a sharp intraday 1 min 3C down turn, pretty much only the DIA and ES had a signal like that.

 ES (S&P e mini Futures) also saw a 1 min fast moving negative divergence that pulled on price a bit.

 As for the IWM/Russell 2000, the 1 min chart clearly shows yesterday afternoon's positive divergence, as the IWM puts in a consolidation triangle, that positive divergence continues to build, I'd expect a pop up out of that triangle short term.

 The 3 min chart shows a cleaner version of the same positive divergence in the IWM.

 At 5 min the positive migration starts to fade, there is a relative positive divergence within a larger leading negative, so I'd look for a move up, which at this point is just part of normal price action, it rarely moves in a straight line. With volume low this week, moves have the potential for exaggeration as we saw in Crude yesterday (although that had more to do with manipulation and relatively huge volume coming in to that market-still low volume can make for higher volatility.)

 The bigger picture 30 min chart in the IWM is interesting, I don't even need to count the relative negative divergence from the 7th to the 14th, I can just look at the leading negative divergence since the 14th as enough time has passed that the 30 min chart's signals should be valid.

 QQQ 1 min shows a similar positive divergence which accelerated yesterday in the afternoon and thus far 3C/price are pretty much in line, so large caps in the Dow are trading a bit differently than the other averages which so far is on an intraday scale, but it would be interesting to see what might come of that. Although the DIA 1 min signal was negative and it lost ground quick, that doesn't paint the whole picture, not by a long shot. I'd like to look at the Advance/Decline lines and breadth indicators in the Dow vs any other average.

 QQQ 2 min is pretty much in line with price.

 The 5 min is in a leading negative position, however trade intraday is nearly exactly the same as the 3C movements.

 QQQ 15 min leading negative.

 SPY 1 min positive from yesterday afternoon and a negative divergence as the SPY hits resistance in the form of yesterday's close.

 SPY 2 min is nearly perfectly in line with price.


 The 5 min has some decent size swings in 3C, but it is leading negative and pretty much in line making lower highs and lower lows.

SPY 15 min is leading negative, even if we don't count the large relative negative divergence.


DIA Intraday

Take a look at this chart...


ES looks similar, I haven't checked the rest as I wanted to get this out ASAP.


Trouble In Europe... Again

The European stock markets are lower on the day after what was called, "profit taking" yesterday, but I'm not so sure as the Bond market is telegraphing something very ugly in Portugal.

The Portuguese 10 year bond last seen at 8.66! That is wildly high, something is being priced in by bond traders and it's not good.


PCLN Check-up

PCLN is another core short, this one I'll be keeping open.

 PCLN was a short opened in this area at $761.79 on a head fake move, it saw a huge gap down day of over 17% in a single day, I should probably have taken at least partial profits there and re-opened the closed partial profits somewhere in this area as it reaches to fill the gap.

 A closer look at the entry, this is a small descending wedge consolidation/continuation pattern which traders expect to break out to the upside and then put in a new leg roughly the same size as the previous leg before the wedge, which would have meant a a substantial move of perhaps 200+ points, but we saw something different.

 A negative divergence on a 60 min chart as PCLN broke out, dragging a slew of new long positions with it. As the breakout failed, the downside momentum really picked up as is often the case with failed moves. I saw no reason to exit PCLN as it consolidated laterally as the 3C chart continued to deteriorate then it gapped down over 17% in a day, since we have seen a move to fill the gap. There's a negative divergence on this chart on the gap fill move.

 The 15 min chart showing the gap fill has been deteriorating in to higher prices.

 The 10 min chart is also deteriorating on post F_O_M_C data with a quick run of the limit orders this morning.

 The trend of the 3 min chart has been in line with price for most of the gap fill, that ha broke off and turned negative.

 A closer look at the 3 min chart in what appears to be a tower top-type formation. I'd be considering adding to this as a short had I taken partial profits at the gap down day. As it stands now, I'd wait for a break and then try to short the first bounce so long as everything remained conducive to a short trade.

The 2 min trend is doing the same as the 3 min, confirming and recently changing with a leading negative divergence as the gap area is approached.

I'll set some price alerts if any one is interested in a possible PCLN short position or add to as for the core short established already, I'll leave it in place.

BIDU Charts

 The majority of the short position was established in the $150 area on a phased in entry, that was up nearly 26% while the add to position to $134 gained +16%.

 As you know I've been looking for a move up in BIDU to at least fill the gap (yellow), but even better would be to make a higher high, at that point I wanted to look at starting a new or add to position in  BIDU. At the June 4 market lows I decided to hedge the core shorts such as BIDU rather than trade around them, that worked fine in preserving BIDU's profits, but with a decent probability of BIDU making the move I've been looking for or better, I decided to go ahead and trade around it as the signals in BIDU look pretty good for the move I've been looking for most of September.

 Here's the BIDU 60 min chart and in yellow the two short entries, both had good negative divergences, there's a positive now like there was at the July low.

 Here's a closer look, the short entry was beautiful with a head fake move, this hourly positive though isn't worth hedging after BIDU has had an extended move lower over some time. If it presents the opportunity, I'll take it as I had planned before.

 The 10 min BIDU chart and just hitting stops on a positive divergence, this is one reason I think in the near term BIDU will make a move higher.

 The volume was up on both moves below former support, it looks VERY much like an intentional run of the stops as the move is just enough to trigger stops, but not by any means an impressive move down, therefore it appears that the stops were used to accumulate the shares on some volume and at a discount.

Furthermore, the Swing BIDU Trend Channel was stopped out 2 days ago, this little pullback offers a decent exit on that signal. Also with the Trend Channel turning, I'm thinking the move up to at least a higher high is looking more probable.

Closing out BIDU Equity Core Short

I'm going to close/cover the BIDU core short, I'll show you why in the next post.


UNG's pullback looks complete

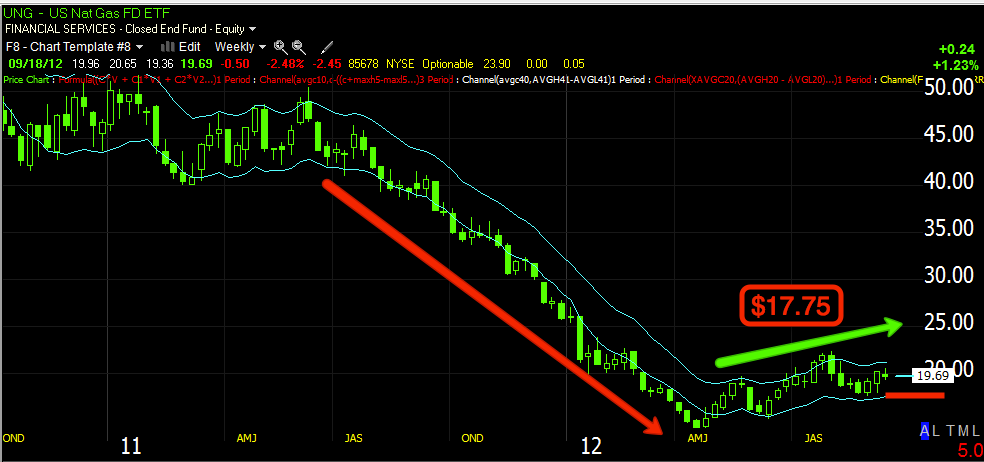
This is one of my favorite primary trend longs, meaning a longer term position that appears to be ending stage 1 (base-accumulation) and preparing to move to Stage 2 (Mark-up or trending) and judging by the formation of the base, I'd say UNG has a solid platform from which to launch a trend higher. This is one of those stocks I am very patient with, it reminds me a lot of BPT (BP Prudhoe Bay Royal Trust) which I bought in 2000 as Bush II came in to power, with the former CEO of Halliburton as the VP and an oil man as the President, it seemed logical that oil was going higher. I held BPT making a nice 12% dividend around the time I bought it, but I didn't hold long enough; I ended up selling at about $30, my Uncle who worked for Morgan Stanley who also bought it on my recommendation still has it today at $94.00 all the while collecting what is now a 9.9% dividend or about $9.31 a year which is close to what we bought it for! Since then I developed the Trend Channel so my stops on trending stocks like this would never again be arbitrary or out of fear, but based on something real and tangible that suggests a change in direction.

I think UNG may just have the capability to put in similar gains, less the divy.

 We were looking for, as always with UNG, a constructive pullback and it seems we got one. The 10-day moving average held on a new long signal as the first pullback with a Doji/Morning Star candle at the 10 day.

 The 1 min chart shows why the pullback was constructive, there's a positive divergence in to the pullback so it seems UNG is gathering strength on the pullback which is what it needs in this area to move to stage 2.

 The 10 min chart makes the trend more clear.

 The hourly chart shows the improving underlying trade since the base was started to the present, where it appears to be about finished.

 On a Swing basis, the 1 day Trend Channel works fine, the stop would be around $19 right now, I prefer a wider stop as I look at this as a longer term position.

The 5 day Trend Channel held the entire downtrend and has thus far held the entire base despite the volatility, the stop is around $17.75, but it will continue to lock in gains and rise.

I still like UNG very much in this area.