Wednesday, September 26, 2012

Nothing Much Changed in AAPL

Basically to this point any way, there isn't anything that would have me thinking about closing the AAPL core short position. With the way things stand now, if anything, I'd be looking to sell or short price strength in AAPL. Believe it or not, AAPL wasn't the first market darling that everyone was in love with and saw a parabolic move up. Anyone remember MSFT?

 AAPL with a parabolic move up on a 7-day chart, these moves are spectacular, but they also have the "Bubble-Effect", the belief that these kinds of gains are sustainable, this time it's different, etc. I think we've seen enough of those moments over the last 12 years that we should be wise enough to know that it's never different, a bubble i a bubble and they all burst.

 Look familiar? That's MSFT.

 And since that parabolic ascent, MSFT lost all hints of being a growth stock, one thing that seemed to kill growth in MSFT was the declaration of a dividend, like AAPL did this year.

 The recent parabolic move in AAPL I have warned about several times in saying, "They usually end badly and sometimes worse than the initial move"; this is a 5-day chart so the IP5 release rally has been retraced.

 The downside momentum i slightly greater than the upside momentum which is typically the case as Fear is stronger than Greed.

 5 min chart which gave a hint of the rally to come before the IP5 release as AAPL's 5 min chart went leading positive, it has gone negative since, but I was waiting and hoping to see a leading negative which showed up yesterday, thus far today hasn't done much of anything that changes what has happened in AAPL.

If there were some strong accumulation we would almost certainly see it on the faster 3 min chart, there's nothing to speak of other than maybe an oversold bounce brewing; this may offer some low risk short entry opportunities if you didn't already start a position.


RIMM Longer Term Trade Idea

If you are looking for a longer term trade idea on the long side, then RIMM may be of interest to you.

Last year we followed RIMM pretty closely with a long trade and some short trades, but now it's showing a significant change in character that looks a lot like a stage 1 base. I would probably not jump in to a position all at once, but maybe get my toes wet and look for the tactical opportunities to add while keeping a wide initial stop as a stage 1 base, like a stage 3 top, can be quite volatile.

 We went long RIMM at the white box, it lost ground from there, but the 3C signals stayed positive so we held, eventually we exited the trade at a profit of I believe somewhere around 10+%. We also have had numerous short trades in RIMM, but the ROC recently is showing a change in character and changes in character precede changes in trends.

 As I had just mentioned a day or so ago when talking about "W", double bottoms and tops, the long standing technical dogma that says the second bottom is shallower has not been the market behavior over the last several years (probably close to 10 years really). Here we se an initial support level broken two subsequent times, each deeper than the last. We'll see the underlying trade at each of these breaks as well and you'll understand why this happens.

 First a large change in character on the very important 60 min chart from in line with the downtrend to a leading positive divergence as the downtrend loses momentum.

Here are the breaks to new lows that Technical Analysis says shouldn't happen, but with each new low, more and more stops are hit, creating volume/supply on the cheap which becomes easy to accumulate in larger chunks without calling attention to the stock while it is under accumulation and driving prices up before they are done putting together their position; this is why we see these head fake moves and note that each move below support isn't large, just enough to trigger the stops and create supply.

In any case, I'm not seeing a GREAT tactical timing set up, but strategically, RIMM looks to be one of the few longer term long positions that is worthy of consideration.


MCP Up 4+%

Although I can't rule out MCP building a larger base, I am inclined to think it has at least a decent swing move in it.

 MCP daily chart looks like capitulation at the red arrow, support formed and there was a break below support at the yellow area that created a lot of supply, you'll see that was accumulated in the next chart.

 Here's the break below support at the yellow area with a 30 min leading positive divergence as the volume/supply created was accumulated, then we have a pullback signal at the red arrow.

 Since however, the 3 min chart is leading positive as it seems MCP is accumulated at lower prices.

That divergence migrated to the longer and more important 5 min chart where it saw another positive divergence on today's intraday low.

So far so good for MCP.

PCLN...

As mentioned just 30 minutes ago or so, you my get a chance at PCLN. As with the rest of the market broadly, PCLN is showing some short term positive intraday divergences.

 1 min longer term

1 min positive this morning

Market Update

With yesterday's dominant Price/Volume relationship (out of 4 possibilities) being Price Down/Volume Up, it makes a short term oversold condition very likely. The overnight futures also looked like a bounce today was the most probable outcome. Now that we've burnt through the market chasing orders of morning trade and seen some lateral cupping in price, the intraday positive divergences are picking up. I'd prefer at this point to see a bounce soon rather than let the market move sideways for a longer duration and let the positive divergences build since we already have some very convincing charts and probabilities. This could also give you a chance to enter, phase in to or add to short positions you may like on price strength, reduced risk and likely higher probabilities.

Here's what's been happening this morning in Gold, Oil and the averages.

GLD 1 min leading positive, the 1 min timeframe is the least influential as far as the market's trend goes, but it is useful for intraday moves and tactical positioning.

USO is seeing a 1 min leading positive divergence, this in addition to some larger positive divergences already in place in oil.


  The DIA never confirmed the move down this morning on the open and rather stayed in a positive position on the  1 min intraday chart (this isn't an influential timeframe, but for intraday moves it is useful). Since the open, the DIA has built on that positive position with a leading positive divergence.

 IWM has seen the positive divergence creep out to the 3 min chart, although not very strong at this point, it could continue to build.

 QQQ 3 min positive divergence.

 The SPY 2 min also is leading positive as price flattened out. The divergence could continue to build from here and make a larger move up likely, but I still suspect as of now this is more of a 1-day oversold bounce.

Market looks close to an intraday turn

The lateral/rounding of late this a.m. is the kind of price action I' expect as a straight line "V" reversal isn't likely. There are positives building in the averages, oil and GLD. I'll get some charts up.

PCLN Follow Up

PCLN is now the best performing equity core short position (after BIDU was covered) at an 18+% gain, on the 19th I covered PCLN and said it was very close to an add to position.

Lets take a look because this one (if you didn't take advantage of some recent intraday moves to the upside), is still in a decent overall position as it seems to be completing a counter trend rally.

There aren't any strong signals showing PCLN likely to put in a decent bounce right now, they may show up, but this is probably a decent candidate for a phased in entry with a wide stop (taking on fewer shares) and allowing yourself the room to add to the position on any price strength.


Above in the yellow box is the core short entry on a negative divergence/head fake breakout move. Note how these positions are shorted in to price strength, but underlying weakness as there was a large 60 min negative divergence. To the right we have what looks like a counter trend rally ending as it just failed to fill the gap.

 On a daily chart here's the entry after a false breakout or head fake breakout from a wedge, you really couldn't get better positioning. The small yellow arrow is the 19th when the last update was published.

 The  30 min chart shows the end of the counter trend rally and how 3C had gone deeply leading negative, with resistance being very clear, a head fake move above it becomes very likely and that's just what happened at the yellow arrow above. This is one reason price alerts are a traders best friend, there's no way to keep track of all the opportunities in real time as they can happen so quickly, price alerts are a great tool.

 The 15 min chart falling apart even worse since that head fake move to the upside.

And the 3 min chart which has shown this area to be under distribution since at least the 14th, actually much longer, but thi is where it becomes a higher probability trade.

If you can get a better price entry, feel free to check with me on the underlying action, otherwise as mentioned, you might consider phasing in to the position in 1/3rds or so.

GOOG FOLLOW UP

I  already have GOOG as a core short position, Monday we started tracking deterioration in GOOG's parabolic move up, today it continues after a candlestick/volume signal yesterday. Personally if I were looking to enter or add to the position (if you didn't when it was near its highs with lower risk), I'd wait for a corrective upside move rather than chase it, there are a number of advantages including lower put premiums.

Here's what GOOG looks like today and over the last 3 days.

First I never trust parabolic moves, they tend to form right as a stock is making it's last gasp move and tend to end badly-sometimes worse downside than upside. Note also this is not the type of move that has been characteristic of GOOG over the last couple of years, it only came once demand rose a GOOG passed resistance and during Q3.

 Yesterday's bearish candlestick (shooting star) combined with large volume is a reliable reversal signal on almost any timeframe, I'm not sure whether we get the confirmation candle today or not, but I'd say GOOG's run is about done.

 The 2 min chart shows how quickly GOOG's underlying trade deteriorated and just as Q3 ended.

 The 5 min chart has a lot of damage as it leads to a new low.

And the 10 min chart also shows the clear trend of underlying action that would not be obvious in price alone.

As mentioned and shown yesterday, longer term charts from 15-60 min are also starting to fall apart which is an unexpected bonus.

I'd set some upside price alerts and see if you can't get better positioning on GOOG, whether it's a new position or an add to or part of a phased in entry you started this week.

Deterioration

These are some of the ugly charts I mentioned in the last post, it's amazing how fast they turned down and how deep. I would imagine we could see a week of upside and still not undo the damage that has been done.

Short term divergences may bounce the market and price may even move toward an area that doesn't look that bad, but the underlying damage done here and especially after Q3 ended, it seems they were just waiting.


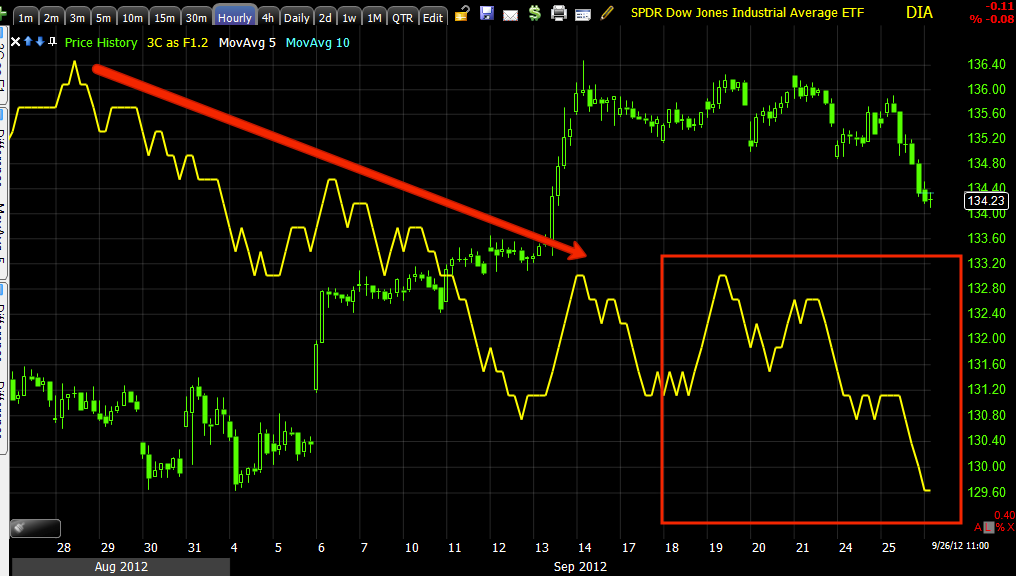
 DIA 30 min leading negative-for a chart this long (30 min), a leading negative divergence is a very serious signal.

 DIA 60 min chart looks even worse , also leading negative.

 IWM 5 min is in a relative positive right now between the 20th and present, but that is within a leading negative divergence which is much stronger.

 IWM 10 min a new low leading negative.

 IWM 30 min also a new leading negative low.

 IWM 60 min is really ugly with a new leading negative low. Price is nowhere near as ugly as the underlying trade, yet.


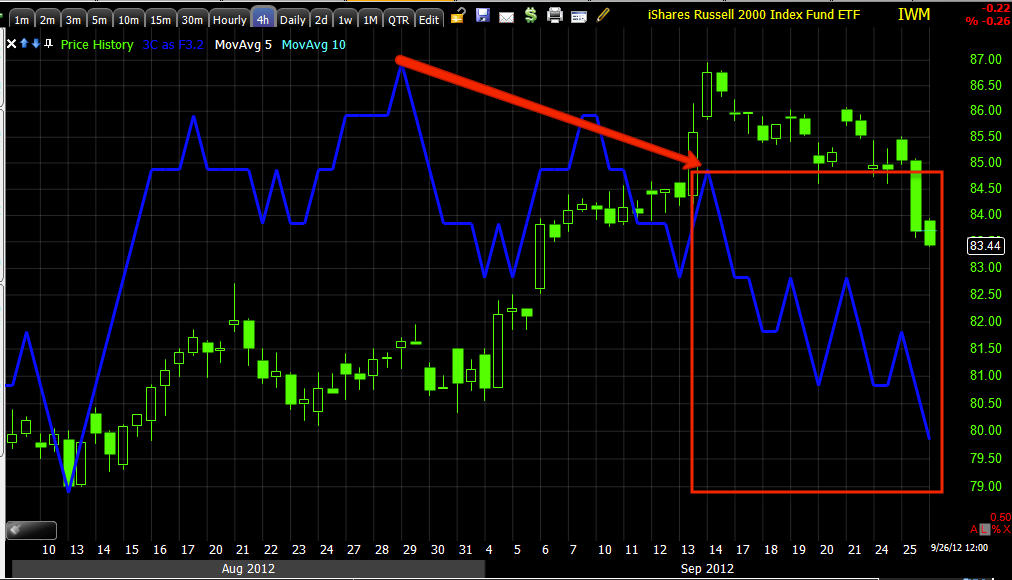
Even the IWM 4 hour chart is leading negative in this short space.

 QQQ 10 min at a new leading negative low.

 QQQ 30 min leading negative.

 QQQ 4 hour leading negative

 SPY 10 min at a new leading negative low.

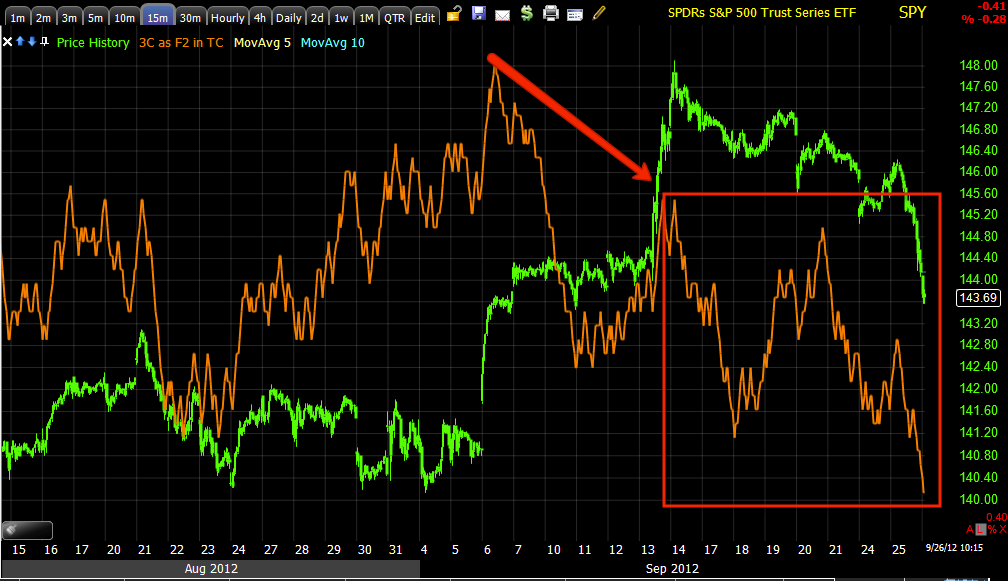
 SPY 15 min also at a new leading negative low.

SPY 60 min again a new leading negative low.

There's a lot of damage to the charts that's not yet reflected on price, even with yesterday's S&P largest drop in 2 months.

Opening Indications

The open is always a misleading time as overnight and pre-market orders, especially after a day like yesterday, are ran an ultimately taken advantage of.

Between the overnight longer term intraday futures (5 min) and the opening indications in the DIA, QQQ and IWM, I'd still say we bounce.

On the other side of the coin, it's amazing how bad the charts look on most timeframes, yesterday doesn't seem to have been a fluke; I'll post those shortly.

As for the opening indications...

 DIA 1 min relative positive divergence.

 DIA coser view of the open, it's not much of a divergence, but it's not the downside confirmation we had been seeing.

 IWM 1 min opening positive divergence.


QQQ 1 min opening positive divergence.