Friday, January 11, 2013

Were You In URRE? Did You Close It?

Yesterday one of the stocks that I think is going to be a secular bull within the next year or so made a decent run or capped off a decent run leaving some positions that were formally underwater at a double digit profit, but yesterday was the time to close that position. URRE may very well make for a great pullback buy, but we'll have to let the market tell us if so and when.

Here's yesterday's post laying out the reasons to close the trade or at least trail a stop. I did get an email about trailing stops under a certain dollar figure and brokerages not allowing stops for stocks like URRE. Most of you probably know I don't believe in placing any order with a broker unless it's an order I'm placing at the moment I want to make the trade, I don't want anyone knowing where my stop is or what my intensions are. So trailing stops are meant just in the sense of using the Trend Channel or a moving average, a Clear Method system or whatever you prefer, it's not meant as a trailing stop available at a broker.

You might think I'm being myopic about the topic, but I had a long position and I was going on a weekend cruise, I was going to miss Friday so I put in a stop quite a bit lower than I'd ever expect that particular stock to move (I believe it was a couple of standard deviations below an ATR. In any case, the stop was hit which was a pretty decent hit because I had it so much lower than I expected, it was like a catastrophic stop, then the stock closed up something like 5-8% o the day and went on to become a big winner. Guess what the low of the day was to the penny? My stop.

After that I decided to close all trading positions before going on vacation for a few reasons, I never used a stop loss like that again (I didn't before that, it was the vacation) and I personally try to keep stops end of day not intraday and especially not a.m. trade.

Here's URRE today, remember it may become a decent long, its character is changing.

Yesterday the closing candle was way too close to a star as I suspected it would be earlier in the day and volume was increased, this makes for a very high probability next day reversal. You could say the same about the day at the yellow arrows, a star and increased volume over the previous day, but the one thing it was missing was a break above those two resistance levels, that's where the action was as far as demand, better prices, etc and it was so close at that point, why wouldn't they go for it.

Any way, I hope you made or saved some money there. We'll keep an eye on it in the near future.

What to do with the AAPL Calls

Looking at the SPY up +0.01% -as close to unchanged as you get and AAPL at $520.32 which knocks out weekly $520 puts, I'd say these weekly options are seeing more and more pins as volume in the market drops.

So if today was a pin and the Calls are down about 8% as I last saw, here's what I'm looking at that makes me say, "I think I'll hold'.

First the reversal I imagine isn't from a mostly flat day and down, I've even described what the candlestick I imagine looks like, in any case, lots of upside volatility early, lot of downside late.

 Toward the end of the day the 1 min goes positive in to  lower prices.


 The 3 min remains positive

 As does the 5 min

Thursday looks like a hammer with increased volume, those tend to be good reversals, however with an op-ex pin it's not going anywhere, so perhaps Monday as I don't see too much damage and late day positives in to lower prices.

Member Submission Friday

This is from George, I can't even tell you how long he's been a member because he's not only been here since the very start, but he was over at Trade-Guild for a year or two before that.

Any way, I consider myself a lifelong student of the market, I try to learn something new and usually do, just about every day. George has told me about this correlation before and sent me the charts, but I never back-tested it to see, I can say this correlation has worked pretty well at some major tops, it doesn't seem to work as well as a bottom finder.

The Dow vs GE...
Check the divergences. When GE is negative vs the Dow, it tends to be right, it actually makes sense if you really think about it from an institutional investor's stand point. Here's a hint, think about the size of GE and the size of institutional positions in GE.


AMZN Follow Up

Ideally AMZN looks the best above $269, but honestly, sometime you get too myopic and miss the bigger picture. If your risk management is under control then you should be fine.


 Since the 11/16 cycle started to the left (white) we have a leading negative 30 min chart, that's a pretty strong big picture signal.

 The 15 min chart is very respectable, although it is faster than the 30 min so it will look worse and have more details. This is the strategic view, the short term charts to follow are the tactical outlook.


1 min leading negative, that almost looks like a small head fake high, not just because of price, but volume there too.

 The 2 min chart

A longer view of the 5 min chart.

AMZN Update

I'll try to get some charts up, if I had time I'd probably add to the AMZN short opened this week I believe it was.

I'd prefer not to be at a full position yet until the market is in line as well.

Charts coming

Risk Assets/Leading Indicators

This is probably one of the reasons I'm not moving quickly to complete add-to positions, I think the divergences will and should look worse. They look pretty bad considering there was virtually nothing there this morning other than a very early divergence that had nothing to do with this process.

As far as Leading Indicators, they too have me a bit relaxed and not running around trying to fill out positions. HYG credit is moving higher, I'm guessing it's a short squeeze, Junk credit is doing the same, I don't know what the short interest was there, but it tends to track High Yield Corporate credit. High Yield is hanging with the market, it's not positive or negative. I don't see much in currencies right now that are that much worse than the earlier update, the only thing I see that has deteriorated materially would be Yields which are diverging negatively with the SPX and pretty bad for a quick move. Yields tend to act like a magnet for stocks, but even Yields could and probably should move lower.


Divergences Getting Worse

Now we are seeing the market's underlying trade start to move more quickly. Most of us have already built a short position and are just looking for the most opportune time to add to the positions we entered partially. If I didn't have some short exposure now, I'd be thinking very hard about picking some up.

I'm not quite ready to pull the trigger on add-to positions, but I'm going to be following them and any other assets that give us a better feel.

 SPY 3 min

 QQQ 3 min


QQQ 5 min

Market Charts

I captured these, but because of what I saw I wanted to look at some of the confirming assets and make sure we aren't about ready to see a quick drop and although those assets are doing fine, they don't have the extreme look just yet, but they are getting there.

So these charts are now in the process from all I can see. The start of this week and every day until yesterday I said I was looking for the SPX/SPY to move above last Friday's highs and more importantly that I did not think we'd see any significant signals until we were above those highs. Also I said many times as well as last night that the higher price can go (I don't think it can do it long), the more effective a head fake becomes and then I posted the two links to the head fake article.

So here are the charts, as of yesterday afternoon we crossed above the area, earlier today we weren't getting any notable signals, now we are, everything we've been looking for is playing out.

Here are the charts...

 DIA 1 min

 DIA 2 min-the divergence is migrating through to more important timeframes.

 DIA 3-remember I said it was unlikely we'd see any extreme signals like this until we moved higher in to the area from yesterday/today.

 DIA 5 min

 The long term 15 min

 QQQ 1 -this is even worse currently


 QQQ 2

 QQQ 3 min

 QQQ 5 min-this is what we were looking for

 SPY 1 min

 SPY 2 min

 SPY 3 min

SPY 5 min

All of the negative divergences are now worse since the capture.

Market Update

Again like yesterday the first half of the day has been small corrective signals that normally I wouldn't even post, but i'm trying to keep you informed.

Right now we have a positive in both the SPX and NDX futures. I'll let you know about the averages in a minute, I need to reset the feed.


AAPL Update

The range in AAPL is getting tight, Bollinger Bands are pinching, I really think it has a move left in it to the upside, after that I don't want to hang around until the dust settles and the probabilities become clear again.

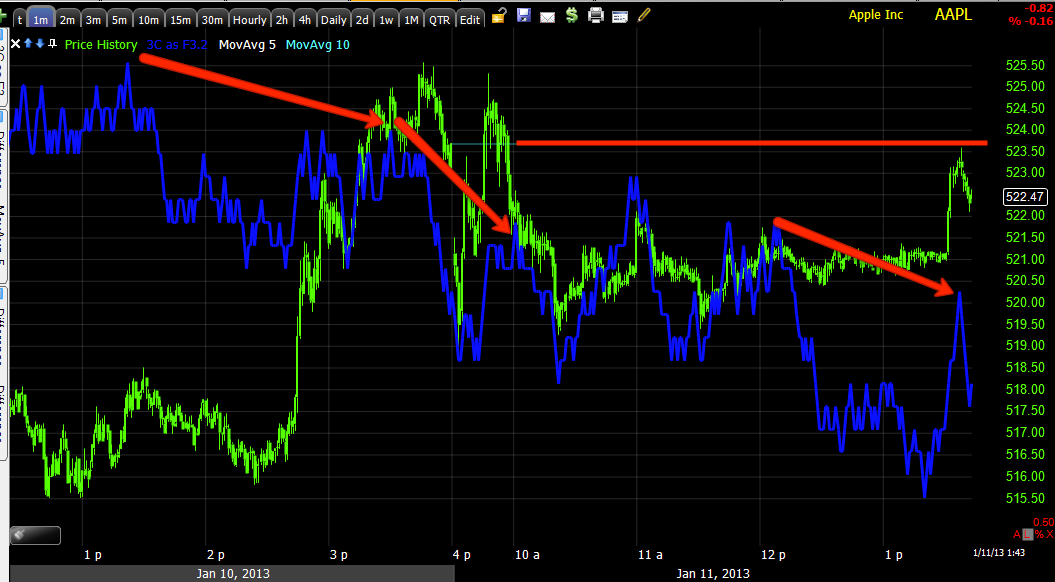
 The AAPL 1 min chart which was trouble yesterday is still playing the same role, exactly at resistance from AAPL's close yesterday the 1 in chart goes negative and creates a stronger resistance area, this may be helpful as more orders (in many ways it doesn't matter what kind) line up above a more defined zone of resistance.

 This negative 2 min action (remember divergences move from short timeframes to longer ones if they are strong enough) is very slight, I don't think the negative 1 min was so much a distribution area as a set up to create resistance for the reason mentioned above.

 Other than the distribution at the early morning gap fill highs that we saw in many timeframes, the 3 min chart is in line with price so the negative wasn't that strong as this is still an intraday timeframe.

I put a green arrow there to mark 3C's relationship with price as being in line/confirmation, it does look like 3C is making higher lows while price isn't, the fact is price and 3C are moving together. It may be interpreted as a bit more bullish that 3C has a more defined path.

 The 5 min chart is still technically leading positive. From the left, remember AAPL gaps get sold, that's been the recent trend this year, we see it to the left and we have seen it on a few individual days the last week, we saw it even at a gap fill.

Basically for now, until/unless that 3 min chart turns south, I still think there's enough in the 5 min positive to take AAPL higher.

Looking at the bigger picture, yesterday I showed you a longer term 15 min chart that looks lie it's been building a longer term base AAPL can move up from. I'm assuming that there would be a trend 2 move to the downside to shakeout weak hands in AAPL and trend 3 would be the move up that the 15 min chart is representing. That's just a best guess, but we can't ignore the price pattern below on the daily.

The price patter is a fairly large bearish consolidation/continuation descending triangle. Technical traders would expect to see it appear after a downtrend like the one that precedes it, they'd also expect for the pattern to break to the downside and start the next leg lower. Interestingly AAPL put in some kind of head fake by breaking out to the upside, descending triangles aren't suppose to do that according to Technical Analysis dogma. I'm wondering if we get a Crazy Ivan shakeout with the upside already being hit and a downside break down to follow as most traders want confirmation before they enter. If that 15 min chart stayed positive through a move like that, we'd have a pretty solid bear trap and AAPL could make a significant move higher. That trade would still be a ways off, but this is one scenario we want to keep an eye on.

Since today's range is getting so tight, I wonder if we might see an intraday downside head fake move before any move higher.