The range in AAPL is getting tight, Bollinger Bands are pinching, I really think it has a move left in it to the upside, after that I don't want to hang around until the dust settles and the probabilities become clear again.
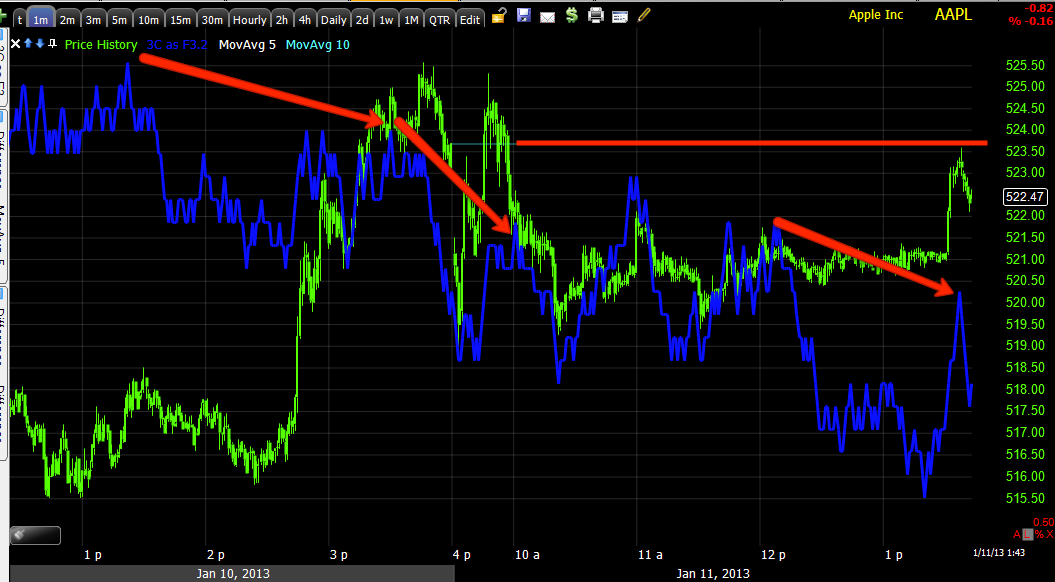
The AAPL 1 min chart which was trouble yesterday is still playing the same role, exactly at resistance from AAPL's close yesterday the 1 in chart goes negative and creates a stronger resistance area, this may be helpful as more orders (in many ways it doesn't matter what kind) line up above a more defined zone of resistance.
This negative 2 min action (remember divergences move from short timeframes to longer ones if they are strong enough) is very slight, I don't think the negative 1 min was so much a distribution area as a set up to create resistance for the reason mentioned above.
Other than the distribution at the early morning gap fill highs that we saw in many timeframes, the 3 min chart is in line with price so the negative wasn't that strong as this is still an intraday timeframe.
I put a green arrow there to mark 3C's relationship with price as being in line/confirmation, it does look like 3C is making higher lows while price isn't, the fact is price and 3C are moving together. It may be interpreted as a bit more bullish that 3C has a more defined path.
The 5 min chart is still technically leading positive. From the left, remember AAPL gaps get sold, that's been the recent trend this year, we see it to the left and we have seen it on a few individual days the last week, we saw it even at a gap fill.
Basically for now, until/unless that 3 min chart turns south, I still think there's enough in the 5 min positive to take AAPL higher.
Looking at the bigger picture, yesterday I showed you a longer term 15 min chart that looks lie it's been building a longer term base AAPL can move up from. I'm assuming that there would be a trend 2 move to the downside to shakeout weak hands in AAPL and trend 3 would be the move up that the 15 min chart is representing. That's just a best guess, but we can't ignore the price pattern below on the daily.

The price patter is a fairly large bearish consolidation/continuation descending triangle. Technical traders would expect to see it appear after a downtrend like the one that precedes it, they'd also expect for the pattern to break to the downside and start the next leg lower. Interestingly AAPL put in some kind of head fake by breaking out to the upside, descending triangles aren't suppose to do that according to Technical Analysis dogma. I'm wondering if we get a Crazy Ivan shakeout with the upside already being hit and a downside break down to follow as most traders want confirmation before they enter. If that 15 min chart stayed positive through a move like that, we'd have a pretty solid bear trap and AAPL could make a significant move higher. That trade would still be a ways off, but this is one scenario we want to keep an eye on.
Since today's range is getting so tight, I wonder if we might see an intraday downside head fake move before any move higher.


No comments:
Post a Comment