Friday, July 5, 2013

USO

USO really looks like it's going to come down, the charts are in position for it to do so, price is looking tired, but I said this last week, the charts looked like it would come down, but because there was a fluid, fundamental issue on the ground in Egypt, I didn't want to mess with it, that's why I'm not even posting the charts which are negative from 1 to 15 min and every timeframe in between, there's also a very parabolic move from about 7/1 (maybe a bit earlier) through today and I just don't trust these, they tend to complete the parabola.

I personally don't want to mess with it because I'm really not up to speed on what's happening on the ground in Egypt beyond the broad strokes which were really predictable that the army would erase any hint of Mursi just like the old Pharaohs use to do with their predecessors (From taking him out to suspending the new constitution and dissolving parliament, they'll erase all traces of the Muslim brotherhood so no seed can germinate in to something that will cause them trouble down the road).

If it weren't for that or if I was on top of the situation, I'd consider a short (speculative) position in USO.

Market Update and Some Ideas I'll be Addressing

I've been going through several watchlists and have picked up on several things from intraday to short term (longer than intraday) to intermediate term positions that look really interesting, I'll try to give you a list and then try to address each individually as to what we'll be looking for, but they really do look good, not just "Well... if this happens, then maybe", they look like "this" will happen.

As far as the market so far, there's some pretty decent intraday strength, either a peg/pin or a reason for wanting to be in this area (I can't quite say "Close" in this area" yet).

Here's a visual of the gist of what I mean...
 SPY intraday went from leading negative on the open, it did what it was expected to in bouncing (off support from Wednesday's close), but it did that on 3C "improvement", not a positive divergence, not even intraday. Right now I have a green arrow that signifies "in line" or 3C price/trend confirmation, but in reality, it's not confirming yet if you compare where price and 3C are right now vs the highs near the EOD Wednesday. So there's some short term "steering" it seems, but...

 On a 2 min chart there's no migration of anything positive which is not surprising as the 1 min chart never went positive.

The open was leading negative, the entire day so far is leading negative, but if I were to zoom in really close, even closer than normal intraday charts, you'd see 3C and price moving together at the green arrow, however this is still not "in line". So it seems that there's some influence being exerted to keep the market around this area, whether that's a Friday pin or some other reason, I'd guess a pin, but we wouldn't know that until after 3 pm.

 The SPY 3 min chart shows no migration and the concept is the same as the 2 min above so I didn't draw on it so you can see the chart without distraction.

The VXX trades opposite the market/SPY and early today when it was at its intraday a.m. highs, I said I thought it needed to pullback at least one more time today just for the reversal process to be symmetrical, that post would have been at point "A".

I also pointed out the likelihood of there being a move below intraday lows, a stop run or head fake and we see that at "B". Again, in this case 3C is leading positive (opposite the SPY)  and like the SPY, intraday 3C is moving with price (green arrow) so they are virtual mirror action of each other as they should be.

 The 2 min is the same concept with a leading positive as we'd hope to see at the break below a.m. lows

The 3 min chart is in leading positive position so from the looks of these, VXX and SPY are opposite each other in almost every way and that's pretty good confirmation.

Now what I want to see before I'd consider pulling the trigger on any position is for 3C to make some vast improvements in VXX at this level, that is what a head fake move is for and that's how we confirm one. I don't know that we have to go all the way out to the 15 min chart above, but if it did (15 min) improve with a leading positive new high, that would be very good trade/position confirmation.

For now I'm just waiting to see which way it will go, so far it has done everything posted ahead of time, so we'll see if it continues to do such and open an opportunity.

Some others would include GDX/NUGT for short term moves.

USO looks like it will come down at least intraday, I'll be watching to see if three's a bigger trade than just intraday there.

SLV is starting to look really interesting too as a long (gap fill? More?) Again, I want to be patient and have a high probability position, not just a higher probability of one outcome over another.

Some positions that look like they are setting up to be stellar out performers on a market move higher and perhaps even before the market, GS looks really interesting, GOOG looks interesting but a bit shorter term and not quite there, IOC looks like it will set up to be a longer term solid out performer on an upside move, AAPL also (which would be a continuation), UNG and URRE but in this case very long term like primary trend.

TLT which I talked about Wednesday as being on my list, but at a much lower area made a big concession today so although the charts were pointing to that and I was hoping to see that, the move is right along the path expected, but much quicker so far so that will be another.

I'll keep watching and let you know of course if there's any high probability positions and to show you some of the above mentioned so you'll know what we are looking for (just as I told you above what I'm looking for in VXX today) thus you know and understand some of the concepts, plus get a feel for what kind of upside move we may be looking at, especially GS's case.


Market Update

The last post, Opening Indications" I ended it with this paragraph,

"I do think there will likely be some opportunities opening today, VXX looks to me (and this would go for the entire market) that it's reversal process would call for at least 1 more intraday pullback, that may be a good area to initiate or add to a VXX / UVXY long or call and obviously the exact opposite for the market averages."

That's what is happening so far, again the possible Friday pin is a consideration so keeping an eye on the market in this area may yield some trades that may be worthy of consideration, I mentioned VXX /UXVY and the market averages, GDX and NUGT would be another 2, actually there are quite a few, but let me show you what I expected just as  a part of a reversal process (so this is more of a broad market concept) and what we specifically want to see as an edge for a trade (and that may not really emerge until the 2:30-3 p.m. hour as is often seen on Friday's.

 ES 1 min intraday leading positive, this would be the move up that would send VXX lower as mentioned above as part of a reversal process which is about symmetry and proportion, at least that's how we can judge it, but those are both a function of the character of how the asset trades.

 SPY 1 min isn't positive, but it is more positive than it was.

However at the 3 min chart we can say that the 1 min chart hasn't had time to migrate that far and make this chart look more positive or more likely that ti won't and this is showing the higher probabilities intraday of an intraday bounce, but ultimately more downside is coming or lastly that we'll have a kind of op-ex holding pattern.

VXX 1 min (trades opposite the SPX) is positive, but 3C is pulling back as expected as noted in the last post.

At this point we have to consider the probability of a run on stops below the intraday low or nearby support a bit lower in several assets including GDX/NUGT.

 VXX 2 min isn't really effected at all, this so far is confirmation of the SPY charts above.

And the TICK for today hitting extreme lows on the downside of < 1250, so far not quite +1000

I think it's about patience right now and letting high probability trades set up rather than just try to jump in to the higher probability trade.

Opening Indications

I can't say I'm surprised by anything I've seen so far in this morning's charts, I can't even say I'm surprised at some of Wednesday's charts that suggested a move up on Friday, I just didn't feel the wild-card risk was worth it and in fact unless you were really "Jonny-on-the-spot" this morning, for the most part I don't think it was worth it, this includes hindsight as there were simply too many fundamental events between Wednesday's close and Friday's open, that's not an edge, that's gambling.

Here's what we have thus far...

 SPY intraday does show a stronger looking chart on Wednesday's shortened day and ends with a leading positive (intraday) divergence, not the strongest signal, but apparently correct which is probably coincidence, but who knows as some other charts are in line.

This morning's readings are obviously much more negative.

This is the exact same chart as above just with no scribbling on it so you can see it without distraction.

This is the 15 min SPY chart which is in line with expectations from the last post, a distribution area at this short-term top and not surprisingly, this morning's open creates a head fake move in yellow, that is interesting considering trend expectations.

 The 1 min intraday QQQ chart is exactly the same as the SPY 1 min chart as far as Wednesday and today...

It's also the same as far as near term trend expectations with slight distribution in the right timeframe (15 min-the same as ES) and again, a head fake move this morning above the range (in yellow). Remember these head fake moves are typically right before a reversal and we are expecting a downside move from here.

HYG 1 min was positive Wednesday early on and went negative in the afternoon, this would have caused doubt as far as taking a position on Wednesday for Friday's open, but it was exactly correct in predicting HYG's behavior this morning and with Credit leading equities, everything seems to fit together very well.

VXX also fits perfectly with a negative divergence on the 1 min Wednesday suggesting it open lower Friday and the market higher, but the leading positive this morning confirms EVERY chart above and every chart posted so far this morning regarding expectations.

The only wildcard/unknown right now that I'm considering is whether we have an op-ex typical Friday pin or not.

I do think there will likely be some opportunities opening today, VXX looks to me (and this would go for the entire market) that it's reversal process would call for at least 1 more intraday pullback, that may be a good area to initiate or add to a VXX / UVXY long or call and obviously the exact opposite for the market averages.


Futures / Market Outlook

You may recall at the start of the week I was hesitant to enter any positions as the week is so chopped up, low liquidity, etc. So far there have only been two positions traded this week, both did well, but not the number of positions for a leg down, you may recall too that I was skeptical of whether we'd see that leg down this week or if maybe even the low liquidity would create a false one, thus I felt it to be a better idea to just sit back a bit this week.

From the futures charts, I think we are still on track, just delayed by a week (this week). The original thinking starting last Thursday was that we started the strong move up expected and we saw the best 3-day move of the year up until that Thursday, but we'd be seeing an interruption of the move with a leg down. My original thinking and current thinking is that the move/leg down will be nasty as Wall St. doesn't do much without a reason and most of those reasons are intended to move the market just like a wrestler needs to create movement in their opponent to open opportunities.

The 3C Index Futures charts posted this morning make that assumption look very reasonable, but the other side of the coin is that the move to the upside, which in my view, should be far stronger, in fact stronger than I think we can even comprehend at the moment, looks to still be very much on the table. You know what I think comes after that and that is why that market move up is really a means to an end or what I'd consider, "The Prize" that we need to keep our eye on.

Here are ES futures as an example of the trends expected, you'll notice (even after going through this week which seems to have been more of a pause than anything) essentially NOTHING has changed in our expectations.

 1 min intraday really helped the SPX on the open despite the NFP as it made a new high for the week just before the NFP, the previous high was from about 4 a.m. this morning. Right now this chart is noisy and I don't think of much use this minute.

 As posted before the NFP this morning, the 5 min chart above and 15 min chart below look much more indicative of the "Leg Down" move expected with the first signs popping up last Thursday.

15 min leading negative divergence, this is one of the reasons I think the move to the downside could and probably should be much stronger than most expect. I think people expect a pullback or a correction as we'd see in a normal bull market move that is really insignificant and makes sense, this is not the same atmosphere at all.

 Interestingly though (and this is the first chart that starts to confirm our expectations), the 30 min chart representing the ultimate "Larger Upside Move"is relatively strong with a much bigger accumulation area than any slight distribution.

And the 60 min chart is where I would be kind of nervous to flip the page and see if the next chart confirmed what the 30 min chart started to suggest (that our expectations were still on track despite this week's potential for chaos), it absolutely does as it has a large positive divergence at the base and a leading positive divergence ever since starting its move to the upside.

Don't forget the position opened before the holiday break, a long in UVXY (VXX) which was in the timeframe that we'd expect the downside move to be in (likely picking up again early next week). The only reason I chose a long equity position over an option position was because I expected there to be noise between this week and the resumption of the move down (VXX and UVXY both typically gain as the market loses ground).

UVXY going from a leading negative divergence and price dropping to last week's very sharp leading positive divergence.

And even though HYG has dropped this morning with the SPX gapping up (suggesting the market in the very short term will be following HYG lower as we expect...
 HYG gapping down doesn't look supportive of the market up here at all and suggests the 5/15 min ES charts are correct, however...

The 30 min HYG chart is a much larger picture and very positive (representing the 30-60 min indications of the ES charts) for a large upside move after the leg down.

I hope my presentation was clear, the charts are clear. The expectations are still the same as last Thursday when the first signs of an interruption to what had already been the best 3-day move all year in the SPX, first appeared. The charts suggested a pause in the start of the larger upside move to see a downside move that will probably be more dramatic than a simple correction, however it does appear to be Just that, A PAUSE. The charts still suggest the very strong upside move (that I believe already started) will continue after this leg down or shakeout) and that move will essentially be the gift that allows us to make the moves that will set us up for the most important trend to come.


Non-Farm Payrolls

Although this is a bit more of the reaction I was suspecting (at least at some point between today and Monday based on the 5-15 min 3C Index Futures), I'd still caution not to make too many assumptions regarding market action for the rest of the day, it's Friday, low liquidity, high emotions (which can be used either way) so we typically have the pin, but that pin over the last 6 months or so has been pretty darn close to Thursday's close (Wednesday this week) so a move down toward that area may not be too surprising NFP or not.

Here's the actual data for Non-Farm Payrolls from 8:30
Released On 7/5/2013 8:30:00 AM For Jun, 2013
PriorConsensusConsensus RangeActual
Nonfarm Payrolls - M/M change175,000 161,000 145,000  to 200,000 195,000 
Unemployment Rate - Level7.6 %7.5 %7.4 % to 7.6 %7.6 %
Average Hourly Earnings - M/M change0.0 %0.2 %0.1 % to 0.3 %0.4 %
Av Workweek - All Employees34.5 hrs34.5 hrs34.4 hrs to 34.6 hrs34.5 hrs
Private Payrolls - M/M change178,000 175,000 150,000  to 200,000 202,000 

As you can see, they came in at 195k, significantly above the 161k consensus, above the 175k prior and near the top of the 200k range. Furthermore, May's 175k print was revised higher to 195k.

The under-employment rate (U6 which is a lot closer to the way employment was gauged in the 1920's and I'm referring to the unemployment extreme during the depression of 25%) really popped from 13.8% to 14.3%. The headline employment rate is called U3, there are 6 different classifications.

I'm not going to cover the specifics, you can get those anywhere, but, I will say this... You may recall after the September 13th F_O_M_C QE3 announecement I noticed a more hawkish (at least strong hints) tone coming from the F_E_D ,like the question around 2:20 to Bernie about inflation and his answer about adjusting the size of assets that topped the market out that very minute afte having shot up after QE 3 was announced. The most significant development in my mind that showed the F_E_D's intention was to talk about and then change from a Calancar date guidance model which is very objective (QE will go on until XYZ date and rates wont move at least until XYZ date" to the much more subjective AND MUCH EASIER TO MANIPULATE, "ECONOMIC CONDITIONS", which is as subjective and easy to manipulate as it comes, this introduced a great deal of uncertainty in the market and this is why I beleive the rally at the start of the year was nothing but distribution, 3C shows it and market breadth shows it exceedingly clear.

In other words, the F_E_D found a face saving way they could basically do whatever they wanted to with guidance (we all know these reports and if you have doubts, look at the Economic Surprise Index over the last several years and specifically at the first quarter of the year when seasonal adjustments allow data manipulation very easily, then watch how the indicator drops from positive to negative). Once the F_E_D moved to change the yard stick after all these years, it became clear they were thinking about a different direction, the market doesn't like today's better than expected NFP as it makes September look much more likely as the "Taper-date".

We'll take a look at how this has changed the complexion of futures and the open shortly.


It's All NFP from Here

I hope everyone had happy and safe 4th of July holiday.

So Futures have seen a pretty nice move indeed, from Wednesday's 1 p.m. (regular market closing hour) ES has moved from $1608.50 to a high put in just after the European open this morning (as the Bank of England and the European Central Bank both have come out sounding like a counter-balance to any F_E_D tapering talk , in other words sounding very dovish) of $1626.75. Since then we've lost some ground.

With low liquidity today as no one who makes under $100k on Wall Street is going to be working today, it will be the NFP at 8:30 that shapes trade unless it's a middle of the road number, consensus is $161k with a prior of 175k and a range of 145-200k.

Otherwise the market looks set to gap above all of this week's range, but I'm not sure how much I trust it, it will greatly depend on the NFP in a few minutes, although I'd caution against early assumptions based on low liquidity knee-jerk reactions.

Here's why I'm wondering if the move of the last day and a half is sustainable near term...

 ES 5 min from Wednesday's close doesn't look like it has much support left.

The same with the ES 15 min chart so there's been migration from in line to negative

The NASDAQ futures look the same as does R2K.
 NQ 5 min

NQ 15 min.

We'll know more shortly, but I wouldn't make early assumptions.

Wednesday, July 3, 2013

New Website Input

Since most of this is for you at this point, I'd like to ask one more time for your input so we can get this wrapped up and online. All of the critical functions and main pages are already in place, just like with anything else, it's the details that take the longest.

I'll give you an idea of what we have so far and what will be different.

Since the site will automatically handle all Paypal subscriptions (now if a new subscription comes through I have to send out the invitations, welcome email/information, email delivery sign up, etc. The new site will handle all of this) it will free up my time. We've been at capacity for a while and I'm actually not trying to encourage new members as I've already had to refund people trying to sign up because the Blogger site we are on now limits private sites, I literally have no space for them.

All current members will get instructions for the new site address and a coupon code, current members will stay at the current membership price, any new members after the new site is launched will pay a little more.

You'll have a lot more control over your preferences, any email address you  want to use will be fine, you'll be able to choose whether you want all posts delivered to you or if you only want certain categories such as trade ideas, or the daily wrap. Posts that are specifically about one subject like a trade, will be color coded in the header.

The new website will automatically refresh so if a new post comes out, you don't have to rely on your email or refreshing the site to know a new post is out.

There are several other member preferences you'll be able to set up and change, including your profile and/or passwords, etc.

The new site will look a bit different, but clean and easy to use.

I've had some people ask about being able to use credit cards outside of Paypal, we checked in to this and the price for recurring subscriptions is just way outside of our budget.

There have been several requests for text alerts for trades, I looked in to this as I'd need a third party service to do this and I figured out based on their pricing that if I sent every trade entry and exit for a typical recent week to every member it would cost about $300 a week and that's not including the site growing, it's also almost 10,000 more texts than they allow for 1 month.

The only way I can think of to do this is to offer the service as a side subscription if it is important to you, and then it becomes more practical, but if only 1 or 2 people wanted that and were willing to pay the extra monthly amount, it wouldn't be enough people to make it affordable, on the other hand if half of our members wanted it, it would be too expensive and run over their monthly limit so I'd either need to get some idea of how many people are interested in it, I'm just making a wild guess and thinking it might be $10 more a month (obviously depending on the number of people and package). Or, if anyone has alternative ideas beyond the color coded posts and the ability to receive them now in email format (you could choose to receive all posts or just trade ideas or any mix of the different categories).

However if anyone has alternative ideas, I'd love to hear them.

There are certain things I'm considering and these are really small details, but they are taking up a lot of time, like a risk management calculator.

Somethings we've looked at over and over and just can't find a good solution for, but I figured I'd ask one last time before we lock this down because I really need to get the details taken care of so we can get this up which will make my life easier and the service more user-friendly and customized for you and I won't have to keep sending refunds and long emails describing the situation for people who want to become new subscribers.

I'm hoping that within a year or less that the site will be able to sustain such functions as a 1-800 number instead of emails for important questions you have during the trading day, web or podcasts on certain topics or concepts that are interactive with members, I'd like to add someone else who does what I do, but perhaps is better than me in a specific field and yes, I really do mean it and want to have things like a discounted rate cruise for members and we can spend a couple of hours doing a seminar (I'd love to have some guest speakers and have talked so some really amazingly talented people who would be interested) or some live trading and then enjoy the rest of the day.

One bridge at a time though and the first is settling on the details and getting this on line, every week is getting more and more expensive.

Thanks for your input.

TIA


Market Charts and XLF P/L

First the XLF July $20 Put, you may recall I was considering skipping trading this leg to the downside altogether, there was something that wasn't sitting well with me and later I realized it was just the make-up of this week and then of course all of the events between today's close and Friday's open with most events catalyzing just before Friday's open including the NFP.

At first today when I saw the 3C charts in early timeframes moving up so quickly or strongly, even off the open they were strong, I wondered if perhaps the NFP had been leaked, I don't think that's the case, especially after seeing how quickly the same charts turned around, as I said when I first pointed it out, I believe it's a function of the lower volume, it tends to produce extreme moves in everything from price to indicators.

In any case, the UVXY position and XLF position were both meant to be short term positions, UVXY I closed yesterday and I think that was the perfect time...
The white arrow is UVXY (remember it was a Call option) yesterday, beautiful momentum, if I were watching price alone I'd have left it open, but 3C gave a clear signal there and it was closed for a +40% gain

If I held UVXY today, even selling early, I'd have lost a good part of that gain.

I DID NOT get a sell signal on the XLF Put yesterday so that stayed open and isn't it amazing that as the market was doing this today....
 The market was finishing the move started yesterday as expected, from last night's "Daily Wrap".

"This is today's NQ (NASDAQ 100 futures) intraday 1 min chart, it should be exceedingly cclear that there was a clear effort to move prices higher in to the close. I took that 1 step further (which I can't confirm until tomorrow) and guessed that Wednesday would close stronger than where we are now, "

So as the market tends to move together and Financials are a large part of that, "Why didn't I close the XLF Put?" Simply because there was no signal to do so.

This is how XLF performed today...
It came within 1 cent of yesterday's close, but didn't move higher like the rest of the market. The only reason I closed it was 1) it was meant to be a short term trade and 2) well you know what 2 is.

The P/L came down like this...


At the fill of $.62, the gain on the XLF put was +24%

It would have been better to close XLF the minute I saw leading positive divergences on the open this morning, but I was hoping to get a good signal by the end of the close today for Friday's action. If there's a lesson I'd take away from this it would be...

"Know why you are in the trade, know why you chose the tool you chose for the trade (XLF Puts rather than FAZ long) and know that the first two reasons are meant to work together and the gap down this morning is the perfect move for the choice of the trade, FAZ would have been a better choice to "Wait and See" through the close today."

Not a terrible error, but an error nonetheless.

As far as the market charts, in the first market update this morning , the post ended with this...

"I wouldn't say anything is conclusive yet, but I would say that all of the readings point more toward higher prices from here and all of them look much, much better than they could otherwise look if things were really falling apart early.

For now I wouldn't back away from yesterday's late (day) idea or thesis of market action (continuing the late day move higher), of course we may have to adjust, but I don't see anything yet that suggests that course of action isn't still the most likely, even with the less reliable a.m. trade data."

I told you in a afternoon update that charts were surprisingly strong, but that is in some part a function of lower liquidity and that I wouldn't take any of the signals to mean much. Also the parabolic move was noted in this post...


Finally in the last market update of the day, this was the entire update...

"As I said, parabolic moves end badly. The strong signals in the market averages turned around and became just as strong on the downside (weaker market), but the move yesterday was finished and did what it was meant to do.

I'll get charts up, but this is exactly why I said I don't think anything that happens today will have much to do with Friday, if we had taken positions based on those signals 30 minutes ago, I'd be very nervous about them right now.

Patience is a choice, often a good one."


Here are several examples of how fast things turned late day.

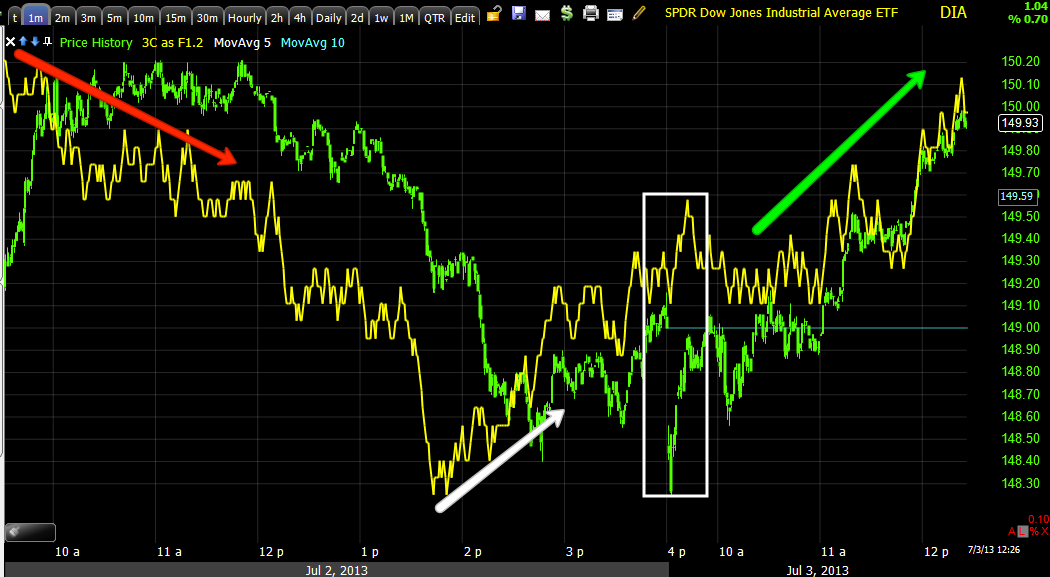
 This is the DIA 1 min (backed up to 12:15 today) showing yesterday's negative divergence to the left and the late day positive divergence sending the market higher in to the close, this was not the typical 3:30 ramp, last night I showed you influential, market moving assets that had started this divergence as early as 1 p.m. yesterday so it did make sense that it continue today and in perfect harmony with the BULLISH SENTIMENT.

 Here's the same chart through the close, note how fast and deep the 1 min went negative

It wasn't just an intraday pullback as it migrated and very quickly, to the 2 min chart which is just as sharp of a negative divergence.

 It also migrated to the 3 min chart with a very deep leading negative divergence, now consider this happened in about 35 minutes, that's incredibly fast.

 The IWM was the only average that remained "In line"- 1 min

2 min

QQQ 2 min went negative sharply

Also migrated to the 3 min

And amazingly to the 5 min in such a short period.

SPY 1 min, these are very deep leading negatives for even a 1 min timeframe to develop this quickly. This is why I hoped to wait until we were closer to the EOD to close the XLF put, hoping it would drift lower.


SPY 2 min migration and a shrp leading negative

Even out to 5 mins.

ES 1 min went negative quickly.

The NASDAQ E-mini Futures went negative even faster and worse.

I'll have more for you once I see how credit's underlying trade behaved as well as the other assets we monitor.

For all intents and purposes, I'm totally flat for the next expected move as I was considering earlier in the week not to trade this one, luckily UVXY calls yesterday and XLF puts made some extra gains, but I feel better flat for this trend until Friday.

If you are off early, have a great holiday.