Thursday, July 11, 2013

Market / TICK Update

There's a specific theme on all 4 averages, 1 min intraday confirmation of the gap either on the open or sometime after and then absolutely no confirmation in the 2 to 3 min area, we consider those timeframes intraday for intraday moves and market makers/specialists, we consider institutional signals as starting at the 5 min chart.

 DIA 1 min early confirmation and deterioration since

DIA 2 min deterioration with a leading negative divergence, I might like SDOW as a long based on the DIA signals above.

DIA @ 3 min intraday, no confirmation at all, on the same trajectory of distribution which can be selling or short selling as both come across the tape as a sale.

 IWM 1 min confirmation, intraday in line.

IWM 2 min not even a hint of confirmation or any strength here, in fact the opposite.

QQQ 1 min with early confirmation and now starting to go intraday negative

QQQ 3 min chart leading negative like the others.

SPY 1 min starting to leading negative

3 min absolutely no migration of any positive underlying money flow.

The NYSE TICK chart (all NYSE stocks advancing less declining stocks) is at a VERY thin range of about +/- 500, this means very few stocks are moving at all right now.

Intraday momentum is stuck.

Going Ahead with the HYG Puts

I think at worst there's a strong probability of at least a pullback, but that's really not what I'm looking for.


HYG Puts Ready

HYG as most of you know is 1 of 3 arbitrage assets, HYG is High Yield Corp. Credit and represents smart money's "Risk on sentiment", these are often manipulated short term as you saw with the SPY Arbitrage yesterday.

TLT is 20+ year Treasuries and represents a "Flight to Safety", but has been acting differently lately here and there

VXX is VIX futures or the reach for protection.

To move the market up or support it through arbitrage of these 3 assets you need HYG up and TLT/VXX down

To pressure the market down, HYG down and TLT/VXX up or out performing their normal inverse correlation with the SPX.

HYG has been up all this week as has the market, in fact in at least 2 daily wraps I pointed out (especially Tuesday) the late day push in HYG that closed it from red to +0.05% gain, but it was for the Arb. value, not the gain.

Junk Credit trades almost exactly like HYG, but has no arbitrage value, it has been seeing strong distribution as a risk on asset for institutional traders. HYG is now following JNK's lead.

So I have Aug. $91 puts on deck and ready to go, just to give you an idea of what's going on in case you see a quick post of that position opening.

As far as the SPY Arbitrage today...
 There doesn't seem to be any "Lever Pulling" or short term/intraday manipulation as the differential is only 11 cents, yesterday it was something like $1.40

However, CONTEXT has not only not been re calibrated...
It's at a differential of $42.27 or about 42 ES points to the downside.

USO Might be a Spec Trade (Brief Update of GLD/SLV)

GLD, although both it and SLV broke lower right after my post re: them, GLD looks more likely to see an intraday bounce which may provide better positioning if taking a long off the table or in setting an appropriate trailing stop. I'd think SLV would move in similar fashion, but it really isn't as F_E_D sensitive as gold.

As for USO, I've stayed away from it because of fundamental issues on the ground in Egypt that are impossible to predict, thus it makes an edge a hard thing to maintain, but there are some decent signals with the $USD having retraced about 50% of the post Bernie decline in after hours.

A rising $USD typically sends these assets lower just as a falling $USD sent them higher last night.

The only way I'd consider the USO position is if it pulled back to give a much better entry with less risk and the signals hold up or better.

The intraday Brent Crude Futures (different than USO / WTI) look like a pull back to the upside is probable intraday.

 This is the $USDX overnight with a beautiful 1 min 3C chart calling out the reversals and thus far even though it's only a 1 min chart, it is still leading positive meaning the probability of some further gains is high. This could turn out to be quite an event of this is more than just a retrace.

 This is the 1 min Brent Crude futures that seem to indicate a pullback to the upside is probable, it would take a pretty decent one and great signals and still it would only be a speculative position, but oil has a lot of froth priced in right now.

 Crude 15 min

Crude 30 min.

I'm not saying the primary leg of this trend is done, I just think a retrace which could be significant for a quick trade, is very likely. As far as the larger picture of this leg up, we'd have to see if divergences migrate to longer timeframes.

USO 3 min

USO 10 min

USO 30 min, the real constant is the accumulation zone, it's the same in all charts, it's not that large that it would normally support a move this far, but this is mostly risk premium from events on the ground in Egypt priced in.

I'll set an alert, if the position makes sense, then I'll take a look, keep an eye on the $USD as well, that's very material to Gold, silver, oil and really all commodities as well as whether the currency market (much larger than the stock market) believes Bernie or not.


Apparently Someone Disagreed Strongly With Bernie

I would say to get this kind of reaction the "morning after", the said member would have felt that this was a cheap stunt, I'm of course assuming a bit, but based on the minutes' tone and Bernie's tone, it would almost seem like it was an integrity issue.

Straight from the F_E_D's website, as of this morning, Elizabeth Duke Resigns from the F_E_D

Dollar Strength is Back

It's a bit odd the $USD bounced back so quickly after Bernie's stint last night, but from what I see, all precious metals (GLD and SLV), if it were me, I'd be taking them off the table (longs) or at least having a trailing stop in place.

As far as Crude, this may actually be a break in crude.

I'll get charts up, but I wanted to get this out ASAP.

Additional Charts

Try to get through this post if you possibly can ASAP.

One of the items that I was most interested to see whether there was an adjustment or not is obviously CONTEXT as a lower model shows lower risk assets among professional traders, were not talking about equities, but credit, rates and curves, FX carry, commodity futures (that's actually an oxy-moron) etc, the risk assets that retail doesn't trade.

Here's what it looked like late last night and then just now (with about a 15+ min delay).


Right around the same area, but the point is, no change.

Sunday night the model looked off, in the Week Ahead post Sunday night I said "I wouldn't be surprised if they re-callibrate the model) and about 2 a.m. in the morning they did just that before the open Monday, however not last night, they are still tracking a 40+ point discrepancy between what professional risk assets and the S&P are trading at.

Now, if you're a professional (rather lets say a hedge fund or institutional trader as there are a lot of professional equity traders)  and you are selling risk assets as the chart above depict, then you'd expect they'd be distributing positions in equities as well.

I went over the general average charts I already know about, but just to put them in one place and with some context (not as in the model above)...
 DOW 30, the first divergence to the left is a head fake move out of a triangle that we expected, then some accumulation we had noticed going in to the week of the 4th of July, it had been the Thursday just previous to that week that the first signs of distribution started showing up, since about that time you can see the signs of distribution have been very heavy.

The IWM is similar, a little later though and that's not surprising as a new high is where the action and volume is for any trader filling in size.

The larger trend however, not as detailed, the IWM 60 min is pretty much on the same page.

I should also point out that the current negative divergence is leading and lower than the head fake move out of the triangle to the left even though price is higher, making it a larger negative divergence.

 The QQQ 15 min and what I noticed in all of these charts is the accumulation period was not very large, when looking at the distribution period, they are about in scale for what you'd expect, however the markets this week haven't been moved by strength, they've been moved by moving overnight futures which are thin volume and a lot easier to move, you'll notice during the regular day the market has a hard time adding to any gains beyond the gap up.

That gap up came largely from the risk asset of AUD/JPY, Tuesday I showed charts showing the pair was going to pull back and it did so, that was the only day or the first day this week there wasn't an overnight ramp and no gap up (yesterday) as the market traded flat other than some volatility around the minutes release. The other driver sending the market higher has been the obvious resistance levels or new high areas that trigger limit orders, but we covered that a couple of days ago as to what to expect and where.

The SPY divergences.

This leads to a larger than normal, but still, Crazy Ivan, all centered on that triangle. A Crazy Ivan is a break out or break down around a well known price pattern (usually) or technical level that shakes out traders on both sides of the trade (shorts and longs), they usually aren't that large and the shakeout is to clean the deck before a next move (trend) starts, this Crazy Ivan is quite a bit bigger than normal, but still focussed on the triangle that started all of this.

There's the large triangle, it was very obvious to see as one of the most well known price patterns that traders would take for a bullish continuation pattern, as you can see the first breakout is in the direction traders would expect, up, but that move fails and is revealed as a head fake, we don't know it's a Crazy Ivan yet. 

The failure of the second break lower to stick creates the second shakeout and we have a third that gaps right at the triangle's apex. If this Crazy Ivan is doing what it's suppose to like the rest, it's doing it on a much larger scale so I went looking for more evidence (although we already pretty much expect the end of this story to not be a happy one)...

First I looked at the large trend 3C and the MACD heat map, the Heat Map is probably new to a lot of you, but if you look carefully and are aware of MACD divergences (typically 3) as a signal, then you should be able to figure it out pretty easy. As far as this version of 3C, I don't use it often because it's not detailed, it's a broad trend, i removed anything in the code that causes noise (and details with it) to give a solid trend signal.

 I drew a lot on this chart, but I break it down more in the next two. The point on the 3C screen is not only is the first breakout confirmed as a head fake with the charts of 3C above, but on this 3C  trend, also the accumulation at the break down lows (same as the 3C charts above showing another head fake to the downside (our Crazy Ivan starts)  and a much deeper divergence on this most recent leg at a new leading low while price is at highs.

GETTING BACK TO MY FIRST POINT ABOUT CONTEXT, IF INSTITUTIONAL MONEY IS SELLING RISK ASSETS ONLY THEY TRADES, THEN WOULDN'T IT MAKE SENSE THEY DISTRIBUTED IN EQUITIES AS WELL? THIS CLEARLY SHOWS THAT PROCESS.

The heat map can be used as a stand-alone trading system, generally 3 divergences do it, but you can see larger trends and smaller ones, the white arrows show the larger trends, look where they line up with price, the last one was at the upside head fake out of the triangle.

 Here  the 3 head fake moves are in yellow and the 3 divergences should be clear on the 3C chart.

The Heat map shows the larger trend analysis as well as the smaller waves at the smaller white arrows, the waves within the larger waves.

And here I just focus more on 3C and give you room to view the heat map without clutter.

So we should see some pretty large signals, I started with 3C, which I already knew...
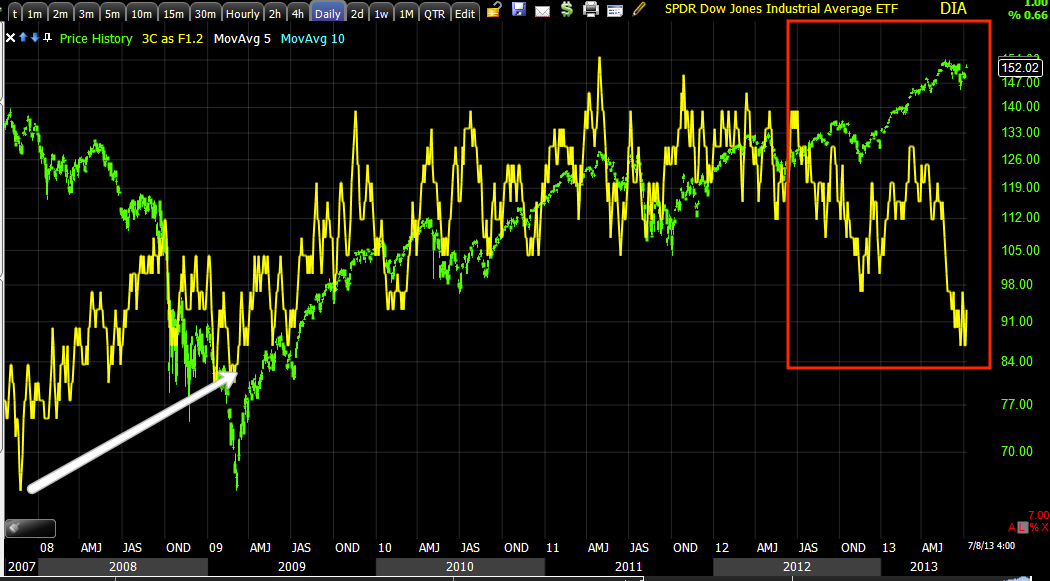
And from 2009 accumulation (rather large) , I think a clear trend emerges after that from confirmation to distribution.

I sometimes double check my work with the only other Money-Flow indicator that I trust,  it was created by the man who started the entire generation of Money Flow indicators, every MF indicator is based on his work with the first, "Tick Volume" and that's the late, Don Worden.

I trust his Money-Stream, I just find it rarely gives signals, but when it does, they are good.
 This is Money Stream (daily) at the 2007 top, it's a good signal, but notice the difference in degree of slope between this and the next.

Cumulative indicators are more difficult to scale, but even without great scaling, the current signal is unmistakable. The first leading negative divergence out of the triangle was the head fake up, the deepest leading negative divergence has been this last leg up, this is a huge distribution signal.

These are the 3C signals of the Index Futures captured last night as I was looking through and capturing all of these.

 These unfortunately aren't long enough in chart history to show their full scale and context, but I think you'll get the idea, especially since Bernie's comments yesterday. ES which was already negative is sharper than ever now.

 The NQ chart

And TF or Russell 2000, granted these are from 2:30 a.m., but they haven't improved one bit since.

A current chart of ES shows nothing has changed and price is proportionate...
 ES 5 was already deeply negative, yesterday's pop just added more distribution which can also come in the form of short selling, both are sales.

Following the migration, as that's how we confirm divergences...
 ES 15 min

ES 30 min

I'd love to show you more, but since the AUD/JPY did this since the open...
And ES has been tracking or being led by the carry pair, I think I need to get back to the market.


Overnight

After watching the market/futures overnight until about 3 a.m. and double checking some signals with some other indicators which I'll post just to make sure I'm not seeing anything, although an out of the blue fundamental event like Bernie completely contradicting the F_O_M_C  meeting 3 weeks ago seems a little.. well disconnected from the minutes to put it plainly; I did notice the AUD/JPY seems to be a force again in the market.

Some of these captures are from the moment, actually many are.


 At least while I was awake, this is about 2:30, the only significant tick down that seemed out of character I followed around to see where it came from.

It turned out the AUD/JPY was the only asset that had ticked down just before, I'm guessing this was probably around the time the BOJ made their policy statement.

This morning I overlaid the two and while the scaling is a bit difficult...
 This is earlier in the night (AUD/JPY purple) , I know scaling on the right looks off, but hold on...

As the pair made a lower high, ES topped out, they traded very similarly  and the 8:30 Initial Claims coming in worse than expected with what Bernanke said last night clearly would put us back in the "Bad news is good news" regime, ESPECIALLY when it comes to employment/unemployment, however at 8:30 the Futures didn't tick up at all, in fact down, but it seems the only reason they'd have to do so is the AUD/JPY (purple) leading them lower.

I'd say over the entire night and pre-market, the strangest thing was Futures didn't spike on the 8:30 Initial Claims missing consensus pretty badly, that would be what the market would need to get continued QE according to "Some" in the minutes and Bernank himself.

I'll follow up with the rest of the charts in the next post.


Wednesday, July 10, 2013

Now that AH is Closed...

Just to have these on record with the appropriate scaling at the time in case I want to show it later...

 ES 1 min @ 8:20 p.m.


NQ (NASDAQ 100 futures) same time

Considering the SPY closed at 0.02%, the SPY arbitrage (or what we call "Pulling the lever" of intraday manipulation) had to see a lot of work (a $1.15 SPY differential) just to keep the SPY closing flat.

CONTEXT continues to widen, I'll be interested to see if they adjust the model to reflect the craziness in currencies, but I'm not sure that they will, it's not like a carry trade closed.


Currency Wars?

Wow, I've just been so shocked at the disparity between the minutes from the June meeting and Bernie's after hours comments.  I've heard some "possible" explanations like the whole "Accommodative is appropriate" (or words to that effect) simply meant that even after a taper or even the end of QE, that rates wouldn't be jacked up until late 2014 or even 2015 and as such, "accommodative policy" is still in place so Bernie didn't really contradict the minutes. That's really parsing words in my opinion, but I think it shows the lengths people are willing to entertain to explain away the disconnect.


What I have seen a lot of as I watch the futures and currencies is absolute $USD destruction, as a result oil, gold, equities, all of the usual suspects have popped higher (and I'll just throw this out there preliminarily, there are some signs emerging that this after hours move is just as likely to be a trap - not an intentional one unless the locals knew what Bernie was going to say, if evidence continues to build to the point I think it's credible, I'll post it).

However in the world of exports, GDP, etc (as China was slammed last night), a devalued currency is great for your country's exports.  On July 4th both the BOE's (Bank of England) chair, Carney and the ECB's (European Central Bank) Mario Draghi both set the tone to devalue their currency and both currencies fell vs the $USD.

 EUR/USD

GBP/USD

So far I count a 349 pip move (from Bernie's comments to the EUR/USD high), on March 18, 2009 when QE1 was expanded to include Treasuries (it had been MBS alone before that) which was also the market bottom, the EUR/USD moved 370 pips, I just counted a move or nearly 350 pips.

So far this is the best explanation I've seen... "Was this Bernie's revenge?"
 Closer look at the EUR/USD

The Euro Single Currency (Germany WILL NOT be happy about this- especially Merkel)

 The $USDX

A wider look at the $USDX...

Staying competitive? Revenge...?

We all know currency devaluation is the name of the game, that's why the G7 couldn't call Japan to task too hard because their all doing the same thing.