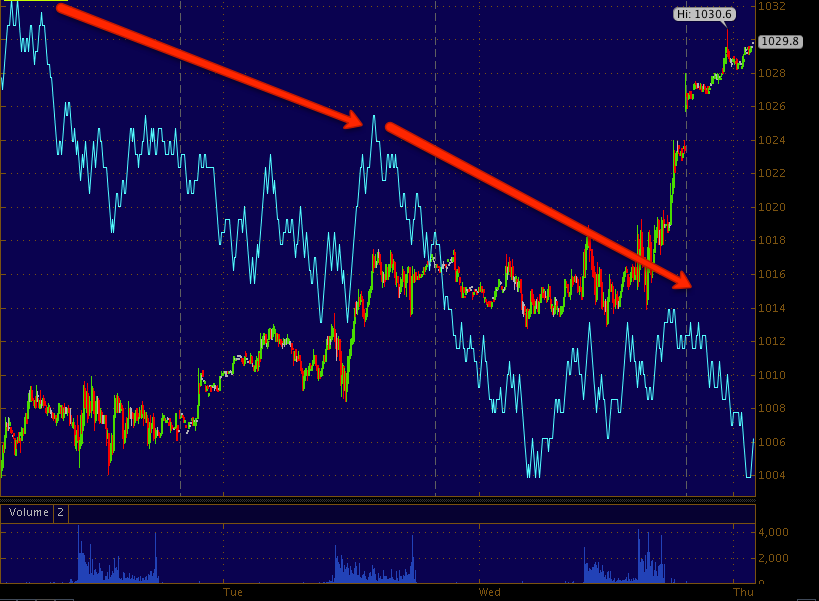
One of the items that I was most interested to see whether there was an adjustment or not is obviously CONTEXT as a lower model shows lower risk assets among professional traders, were not talking about equities, but credit, rates and curves, FX carry, commodity futures (that's actually an oxy-moron) etc, the risk assets that retail doesn't trade.
Here's what it looked like late last night and then just now (with about a 15+ min delay).


Sunday night the model looked off, in the Week Ahead post Sunday night I said "I wouldn't be surprised if they re-callibrate the model) and about 2 a.m. in the morning they did just that before the open Monday, however not last night, they are still tracking a 40+ point discrepancy between what professional risk assets and the S&P are trading at.
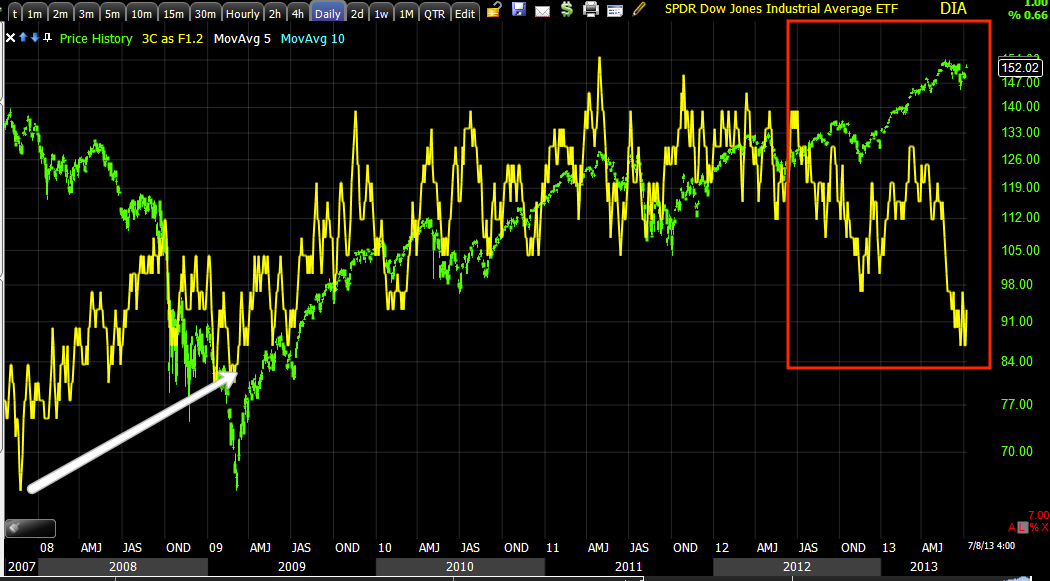
Now, if you're a professional (rather lets say a hedge fund or institutional trader as there are a lot of professional equity traders) and you are selling risk assets as the chart above depict, then you'd expect they'd be distributing positions in equities as well.
I went over the general average charts I already know about, but just to put them in one place and with some context (not as in the model above)...


I should also point out that the current negative divergence is leading and lower than the head fake move out of the triangle to the left even though price is higher, making it a larger negative divergence.

That gap up came largely from the risk asset of AUD/JPY, Tuesday I showed charts showing the pair was going to pull back and it did so, that was the only day or the first day this week there wasn't an overnight ramp and no gap up (yesterday) as the market traded flat other than some volatility around the minutes release. The other driver sending the market higher has been the obvious resistance levels or new high areas that trigger limit orders, but we covered that a couple of days ago as to what to expect and where.

This leads to a larger than normal, but still, Crazy Ivan, all centered on that triangle. A Crazy Ivan is a break out or break down around a well known price pattern (usually) or technical level that shakes out traders on both sides of the trade (shorts and longs), they usually aren't that large and the shakeout is to clean the deck before a next move (trend) starts, this Crazy Ivan is quite a bit bigger than normal, but still focussed on the triangle that started all of this.

The failure of the second break lower to stick creates the second shakeout and we have a third that gaps right at the triangle's apex. If this Crazy Ivan is doing what it's suppose to like the rest, it's doing it on a much larger scale so I went looking for more evidence (although we already pretty much expect the end of this story to not be a happy one)...
First I looked at the large trend 3C and the MACD heat map, the Heat Map is probably new to a lot of you, but if you look carefully and are aware of MACD divergences (typically 3) as a signal, then you should be able to figure it out pretty easy. As far as this version of 3C, I don't use it often because it's not detailed, it's a broad trend, i removed anything in the code that causes noise (and details with it) to give a solid trend signal.

GETTING BACK TO MY FIRST POINT ABOUT CONTEXT, IF INSTITUTIONAL MONEY IS SELLING RISK ASSETS ONLY THEY TRADES, THEN WOULDN'T IT MAKE SENSE THEY DISTRIBUTED IN EQUITIES AS WELL? THIS CLEARLY SHOWS THAT PROCESS.
The heat map can be used as a stand-alone trading system, generally 3 divergences do it, but you can see larger trends and smaller ones, the white arrows show the larger trends, look where they line up with price, the last one was at the upside head fake out of the triangle.

The Heat map shows the larger trend analysis as well as the smaller waves at the smaller white arrows, the waves within the larger waves.

So we should see some pretty large signals, I started with 3C, which I already knew...
I sometimes double check my work with the only other Money-Flow indicator that I trust, it was created by the man who started the entire generation of Money Flow indicators, every MF indicator is based on his work with the first, "Tick Volume" and that's the late, Don Worden.
I trust his Money-Stream, I just find it rarely gives signals, but when it does, they are good.


These are the 3C signals of the Index Futures captured last night as I was looking through and capturing all of these.


A current chart of ES shows nothing has changed and price is proportionate...

Following the migration, as that's how we confirm divergences...


I'd love to show you more, but since the AUD/JPY did this since the open...


No comments:
Post a Comment