Tuesday, August 13, 2013

FSLR Update / Market Update

I mentioned in the last post that nothing looks very good right now and I suspect it's because this move to the downside is probably the ending, blow-off type move of what has been a multi-day, somewhat stealth pullback.

I gave FSLR as an example of the reversal process I think is underway and now I'm updating FSLR to show the continuation of that move which I see in other places as well like HYG, the averages to one degree or another, but it's still fairly subtle.

This is the 2 min FSLR chart now positive whereas only the 1 min was positive before.

More importantly is the rounding bottom in FSLR, this is distinguishing the reversal process which is what we see 95% of the time vs a reversal event, the difference being one is a process, the other happens instantly in a "V" shape which is quite rare.

In any case, I would almost consider FSLR calls / add to or new in this area, but I'd still like to see something more solid than a 2 min chart, that isn't to say progress isn't being made and probabilities aren't shifting, just that I would rarely enter any position on a 2 min chart alone.


Market Update

I've been looking around through multiple watchlists and I'm really surprised that virtually nothing is standing out as a potential short term trade. There are plenty of positions that would be great to short in to with a bounce, tons of those, but for a bounce, not much at all.

The closest thing I even see to a bounce is an intraday 1 min positive in ES.
 ES 1 min positive divergence building

However, take FSLR as a bounce candidate which is probably one of the better looking ones right now.

The 5 min chart is what makes it a nice looking bounce candidate and as it has created a very clear support zone, we know where a head fake move would be to hit the stops which is exactly what happened this morning.

However the 1 min chart doesn't look like FSLR is ready to enter since the decline below support at all, it looks like it could be, but it looks like it needs more of a reversal process before that happens which may happen in several more hours, or...

However as of right now, there's almost nothing I'd be interested in from a risk:reward standpoint, so we just keep watching.

Pullback

As you might recall, last week I was expecting a pullback (slight) before a bounce and at the pullback lows we'd take a look and see if there's anything worth hitch-hiking a ride up with.

Forget just this morning's obvious continuation of the trail of a.m. weakness as a pullback, it's much easier to see if you look at the SPY 60 min chart with a line chart instead of bar or candle, the pullback has been sitting right under our noses.

Since last week when it was expected and continuing today, but we should be pretty close to a bottom for the move. I'll be looking around to see if there's anything that has a worthwhile risk/reward ratio.

Pre-Market

The conventional wisdom is that overnight futures ran up (SPX about 8 points) based on "hopes" that the Japanese government would cut corporate tax rates in hopes of promoting a "consumption tax", which the market is said to have liked and therefore rallied overnight... I guess so?!?

Retail Sales at 8:30 didn't move the market much either way because the headline was a slight miss at .2% vs consensus of .3%, but the internals like sales "ex autos" came in at .5%, were much better so the report was a non-factor coming up before the September meeting in which most think the FO_M_C will begin the taper.

I'm guessing we see the same early weakness, there were signs of it yesterday, but as you recall they were mixed between the SPY and IWM/DIA so not quite as strong as last week's afternoon signals. We'll just go along with the market, look for our windows of opportunity and take what is worth taking at this point, at least until we reach the area in which the big picture really takes on a new and probably very last chance to get involved.

Monday, August 12, 2013

Daily Wrap

The timing of a report released today by the F_E_D couldn't be more ironic for me personally. It has been a long time since I've put out a video simply because they are so time consuming to create, but I was considering working on a video this week about the impact the F_E_D's policies have had and will have on the newest generation of traders who have essentially been in the market since 2009 or later.

I can remember some of the big moves in the Dow that were on the news during my drive home and that's what first got me interested in the market. Under QE1, 2 and 3 there's been no shortage of news like "All time new highs", etc. to draw new market participants in to the market.

However there's a real danger this new generation of traders faces above and beyond the fact that they have no idea how Technical Ana;lysis is used against them every day because they don't have enough experience to remember what it was like when technical patterns and concepts actually worked well before T.A. drew such a large following after the Internet became a household item and online discount brokers put "Stock brokers" out of a job.

That danger is quite simply, "Expecting the market to act as if the Bernie Put was a regular and normal feature of the market". Things like "Buy the dip" have become nearly culturally iconic among the newest generation of traders, they've never experienced a real bull market, what the signs of a healthy bull market are. Perhaps most dangerously, they have no idea of what impact the decreased volume will have when High Frequency traders shut off all liquidity. I think if it weren't for High Frequency Trading in a low market volume environment as we have seen develop since 2009, liquidity would be much more scarce and price moves both up and down would be much more volatile.

There will come a time when HFTs essentially pull the plug and liquidity dries up as HFTs are the providers of liquidity and decent spreads in a market that otherwise has limited volume.

So today's little tidbit giving to us in the form of a 42 page report by the F_E_D should raise some eyebrows just by the name and timing alone,

"Are Leveraged and Inverse ETFs the New Portfolio Insurers?"

"Abstract: This paper studies Leveraged and Inverse Exchange Traded Funds (LETFs) from a financial stability perspective. Mechanical positive-feedback rebalancing of LETFs resembles the portfolio insurance strategies, which contributed to the stock market crash of October 19, 1987 (Brady Report, 1988). I show that a 1% increase in broad stock-market indexes induces LETFs to originate rebalancing flows equivalent to $1.04 billion worth of stock. Price-insensitive and concentrated trading of LETFs results in price reaction and extra volatility in underlying stocks. Implied price impact calculations and empirical results suggest that they contributed to the stock market volatility in the 2008-2009 financial crisis and in the second half of 2011 when the European sovereign debt crisis came to the forefront. Although LETFs are not as large as portfolio insurers of the 1980s and have not been proven to disrupt stock market activity, their large and concentrated trading could be destabilizing during periods of high volatility."

Comparing Leveraged ETFs to the Portfolio Insurance of the 1980's that contributed to the 1987 crash should raise some eyebrows, but the report gets much juicier.

Just look at the tag words (and this is ALL of them): Keywords: ETFs, price impact, financial stability, stock market crashes 

Can anyone imagine the F_E_D putting out such a paper 2 years ago? As I spoke of earlier today, the F_E_D has already engaged in a number of face and legacy saving activities as they know full well and good what the result will be when the F_E_D announces the tapering and/or halt of QE with nothing to take its place and only more bad news to arrive sometime after in the form of rate hikes.

I think sometimes these things slide under the radar and they are meant to, but the F_E_D can always point back to this paper and say, "Well it wasn't because of the halt of QE, it was reduced market liquidity and the rebalancing of leveraged ETFs that created such downward volatility as we warned a month before the crash happened" as an example.

Again, just ask yourself if you can imagine the F_E_D releasing such a paper 2 years ago or even a year ago.

As far as today goes, I think my views are pretty clear on the subject, some other evidence that I think is worthy of consideration is the following...

 Sentiment among the more professional side of market participants held up well today, I believe this is evidence (not by itself) of our bounce occurring.

 The longer version of the same chart shows how  sentiment lead the SPX (green) in red as it turned down before the market and now it is turning up before the SPX.

The VXX did not perform as well as it should have today when compared to an inverted SPX (a normal correlation would see the two moving almost exactly together), instead the short term grab for protection was not as desperate today as we have seen it recently, this is evident in the spot VIX as well and its close today as well as VIX futures.

This is just a slightly longer view of the same VXX chart vs and inverted SPX

Yields move opposite treasury prices and they tend to act as a magnet for stock prices, today yields were slightly higher (vs the SPX in green).

You may recall that I've been expecting a pullback in TLT (20+ year treasuries) and looking at adding to a long TLT position when that happens.

 TLT 15 min leading negative...

30 year Treasury futures, 60 min chart leading negaitve

10 year treasury 60 min chart also leading negative which means yields rise with falling treasury prices and yields act like a magnet for equities so that seems like additional evidence of a bounce.

The view of HY Credit shows how it has acted as a leading indicator vs the SPX and that it is leading positive right now.

Commodities vs the S{X and specifically how much worse they are on the second leg of the SPX move, this speaks more to the big picture, but in the near term...

Commodities have been acting better since last week when we first started seeing signs of a bounce, even as fractured and often weak as the signals have been.

Finally all of the Index Futures have positive 5/15 min charts for a bounce, interestingly they all have negative 1 min charts which I don't usually pay attention to on an overnight basis, but I am looking for a quick pullback before any bounce and all the Index futures have this 1 min negative and it's pretty large.

ES 1 min is just a bit more intense than usual, maybe there's something to this overnight.

That's going to do it for now as there's nothing really new until we get some movement, then there are plenty of opportunities.

I'll report back if anything significant changes in futures tonight


How About Carry? USD/JPY

I'll put together a Daily Wrap for you so you can see the different assets that matter, how they fit, where some opportunities may be (for instance short term hitch-hiker positions may work well in Financials) and there's something that I think may have turned some heads momentarily, but I think beyond the immediate and face-value  news  this event really sunk in.

As far as the market goes, our big picture, the fact that we have been dead-right-on regarding the F_E_D's intensions ever since QE3 was first declared on September 13th, from the way they "slow boiled the frog, looked for a new yard stick that would allow them to use data that is highly subjective and easy to manipulate to determine F_E_D policy and the numerous face-saving measures they have put in place. As of September 13th I thought the F_E_D had for the first time since 2008, made a radical departure from their normal disclaimer, "We have more policy tools that can be deployed if the economy needs it" to a much more sanguine and almost apathetic tone. Then we were 100% correct when we said the F_E_D was looking to change the yard stick by which they measure policy accommodation from something that is objective and clear to something subjective and able to be changed or manipulated on a whim. We were probably among the first to say, "The F_E_D is looking for an exit" and this at the same time they just introduced QE3, who would have thought of something like that at that time? (The answer is, anyone who listened to what Bernie and the F_E_D said rather than what people wanted to hear or what conventional wisdom has been historically). And now the last pieces are being put in place, "The chairman's legacy" so these are face-saving additions.


 I think when looking back on TODAY'S NEWS we will find that the analysis coming regarding what was said today, will be looked back on and we will have been correct again... But I'll get to that later...

For now, one obvious place to look for some short term market guidance other than HYG and other Arbitrage assets, is clearly the Carry Currencies or what is left of them so in that light, here's the USD/JPY and analysis. This is pretty simple, it only takes 3 charts.

 The 1 min USD/JPY which helps the market when it moves up and hurts the market when it moves down generally speaking.

This is the 15 min Yen because the individual currencies are easier to analyze to predict the pair...

The negative divergence in the Yen simply turned it from up to lateral, during the lateral period (smart money doesn't chase anything up) we see a positive divergence currently.

The same has happened, but the exact opposite as it should be in the 15 min $USDX chart, the positive divergence halted the downtrend.

However we have a leading negative in place currently.

Take the Yen's positive and the USD's negative and you get the USD/JPY losing ground in the near futures, this is a headwind on the market so it would seem this fits with out analysis late last week that the market will pullback before making any run higher which is the more important move (between a pullback and a bounce).

The most important move of course is the longer term or rather "Big picture" which is clearly negative.

More to come

Short Term Market Update

Still at an impasse. I'll leave all positions opened recently as they are because they were set up for a move that I think has to come.

Here's a quick look at the dislocation or what almost looks like rotation in the market, but this is CLEARLY not a market that is in rotation, it's not healthy enough.


 If everything looked like the SPY 1 min above, I'd be buying calls for tomorrow, but they don't.

IWM short term charts have seen some progress, but with a 5 min chart like this, I can't ignore the high probability of a pullback.


The DIA 1 min looks to be the opposite of the SPY.

The QQQ 1 min is not as bad as some others, but still the opposite of the SPY.

Normally other assets might settle this like HYG..

The intraday chart doesn't inspire any VERY short term confidence along the lines of the SPY.

The 5 min chart is bullish for a bounce as are most all of the other averages, but that's not where the disconnect is, it's in the short term 1-3 min intraday except the IWM 5 min.

More to come...

Quick Market Update

I personally would not take any positions off the current data, any longs i consider to be "Hitch-hiker trades", meaning they are a means to a greater end and it is really the end we should be most concerned with, if we can make something of the process that gets us there, then I'm willing to take whatever the market offers, but there has to be a high standard.

What I see thus far is the Index futures intraday (all) are either flat to negative 1 min intraday, but at 5 min they show strength and suggest as we have been expecting, a move to the upside.

As you know, 1 min charts in futures are reliable during the trading day, they ARE NOT like the equity averages in which a 1 min divergence at the close is more than likely going to play out the next morning, futures 1 min charts just don't hold up like that overnight. The 5 min charts though carry more weight.


As for the averages, they are a bit scattered, similar to the slightly different futures signals in the 1 min timeframe from negative to in line.

The SPY 1 min is showing CLEAR 1 min afternoon strength as is the 2 min chart, as it stands I'd say unless some significant changes occur before the close, the SPY will either gap up or see intraday strength in the morning tomorrow. The 5 min chart in the SPY has not improved substantially today, but it remains in an overall positive divergence which has been re[presenting the bounce timeframe so the SPY looks pretty good here.

The QQQ is more ambivalent on intraday charts, really closer to inline than anything. The 5+ min charts representing the bounce or late day trade (going by last week's standards) is still bullish for the QQQ.

The IWM is where we run in to the kind of dislocation between the averages that makes me wait it out on the sidelines.

The 1 min through 5 min all look like the IWM wants to pullback. At 10 min however, like the other averages the IWM looks like it has that bounce waiting in the wings.

The DIA 1 min is clearly intraday negative, if it closes like this I'd say there are high probabilities that the same price trend from all of last week and even today to some extent, continues. The 2-3 min charts are closer to in line than anything else and like the other averages (excl. the IWM) the 5 min chart looks like the DIA wants to bounce after a short term intraday pullback.

HYG is not especially helpful in sorting out the 1-3 min intraday charts, although as far as the 5-10 min + charts suggesting the same bounce we've seen since last week, it does confirm as all of the averages (incl. the IWM) do.

For now I am content to sit with whatever positions are open (newly opened) and wait for the short term to clear up before chasing short term calls positions.


Precious Metals Update: Gold / Silver

I have an open SLV $20 Put with a Sept. 21 expiration so I think it will be fine.

What I was looking for last week in entering the position was a quick pullback in gold and silver and then a new high (locally) in both PM's. I'm not taking any longer term positions in either as I suspect at least gold and probably silver too will pullback much more significantly to what might be considered the base or the lowest recent lows before either makes another serious move to the upside and that pullback needs to be confirmed before even considering taking a longer based position.
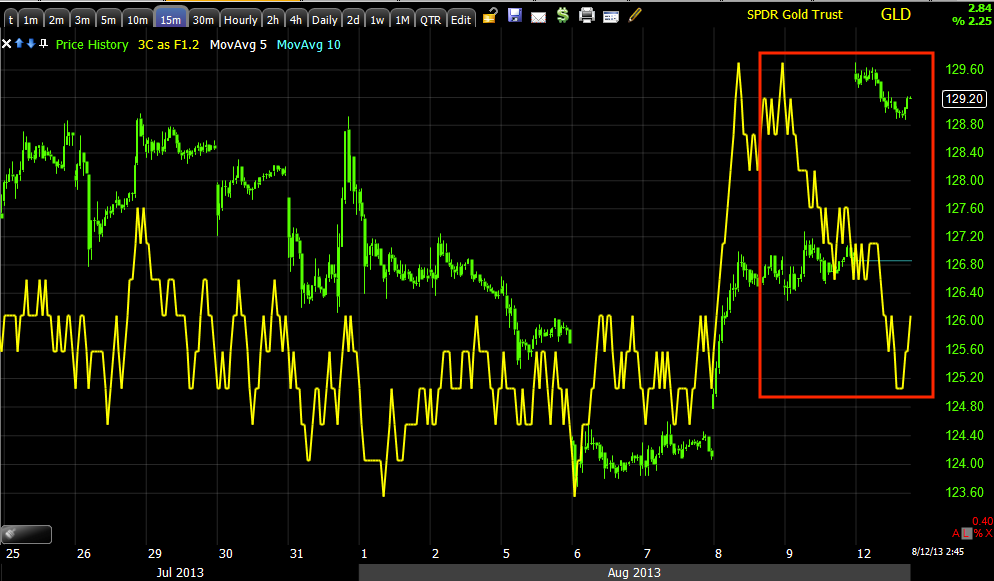
 GLD 1 min seems to be at least in line if not suggesting an EOD ramp. as of this capture,  since GLD has deteriorated on this timeframe.


 The 2 min chart suggested the same as the 1 min chart did before deterioration set in. So far the 2 min chart looks the same, but if 1 min deterioration is setting in, it will likely hit the 2 min chart soon and we should see a pullback in both PMs.

The GLD 10 min chart CLEARLY suggests a pullback before any more significant upside activity.

The GLD 15 min chart suggests the same, I would not want to be on the other side of the 15 min chart in any scenario right now until we see a pullback in GLD.

 The longer 60 min chart suggests as I suggested last week, that we will see a tradable pullback in the PM's before they make a new short term move higher.

Gold futures...
 The Gold futures 5 min chart clearly suggests a pullback in gold

You can see even the 30 min chart is suggesting the same.

SLV's 1m intraday chart saw some late strength intraday Friday and seems to be suggesting more  as of this capture.

There's been slight deterioration since the capture, not as much as GLD

***If there was a clear signal with high probabilities I would consider adding to the Sept. SLV put which also means I'd consider it for a new position as well if you are interested.

 The SLV 2 min chart was in line from late Friday intraday strength, but looks worse than the GLD 2 min looked.

There has been some slight improvement since this capture, I'd call it "in line".

The 5 min chart clearly suggests downside in a tradable format on a 5 min chart.

The longer term 30 min chart (much like GLD) suggests that we will see a move higher after a pullback, however none of these moves are what I'd consider to be positions that are worthwhile without some leverage, at least 2x ETF in my view.

The Silver Futures 5 min also suggests a significant pullback...

The 30 min suggests a pullback, but the broader view is after a pullback a new local high which is exactly what was expected last week when entering the Silver put for the pullback.


UNG Update

*** I'm getting more emails today than normal for a Monday, I'll try to get to them as I realize they are very important to each of you, but my first priory has to be to the group. 

Luckily the new website will relieve me of about 25% of administrative work that I need to do now and should allow me (based on the number of refunds I've had to give to new members signing up, but I have no space for them as we are limited as a private site on the Blogger platform) to hire some help. We have been growing at 35-40% a year (I never imagined the site would reach the maximum potential of available slots using the Blogger platform, but we shot past it early this year).

The idea is that the new site will add a lot of user-functionality such as profiles allowing you to chose the data the is sent to you and in some cases how as well as a number of other personal preferences you'll be able to chose in your profile unlike the current site.

In hiring some extra help, one thing I'm looking to add will be an "800" number so I can more effieciently deal with member questions, for current members who have been with me and are current when the new site goes on line, this will be free of charge, for new subscriptions after the launch, the monthly rate will be higher as well individual services such as "800" access will be billed A la carte and will also be limited to a few calls per week. I have to increase rates, but this is my way for thanking those of you who have been with me for a long time (or a short time, just as long as you are current when the new site takes over).

The point, email response will be "as I can get to it today".

UNG...
 The above is a daily chart for UNG with our VERY simple, CandleStick Concept.

In yellow we have a well formed Harami reversal pattern (to the downside although this pattern depends on the preceding trend). The probability for "Well formed" candlestick patterns goes way up at reversal points that see higher volume (I suspect for tops the volume is churning and bottoms something similar, but including head fake or shakeout moves such as we saw in UNG last week).

In red we have increased volume on no particular candlestick formation, but it is a clear gap below support which triggers stop orders. In Orange we have high volume, but a VERY poorly shaped "Hammer?" It really is not a hammer or anything else so it's not a high probability reversal.

In Yellow to the right we have a well formed hammer on higher volume, this is a high probability reversal pattern.


 Intraday Friday we have a leading positive divergence in to the close, today we have a leading negative divergence in to the gap up, I suspect this is a simple pullback only.

 The 10 min chart shows the accumulation in 3C right at the area the hammer was formed on the daily chart, the intraday chart shows a clear stop run as volume spikes  and it is clearly accumulated, the easiest way for smart money to accumulate without anyone taking notice.

There's a very weak relative negative divergence today, vs the previous signals so again, I suspect a healthy consolidation/pullback.

The 15 min chart also shows the accumulation at the stop run that formed the daily hammer.

So we can see the probabilities of well formed candlestick patterns on higher volume and we can see the mechanics that have caused the higher volume in this case.

***Not yet, but I would consider UNG a high probability add to or new long position as this pullback starts to draw to a close, we should see intraday 3C signals show healthy accumulation as we draw near an end to the pullback, THAT'S WHEN I WANT TO ADD OR CONSIDER OPENING A LONGER TERM LONG POSITION OR CORE POSITION.