Tuesday, September 17, 2013

Quick Market Update

The market is losing a little bit of the gusto that sent it higher, the 3C divergences are nearly untouched from yesterday's 1 min going positive which carried over the overnight session as I suspected and the driver? SPY Arbitrage as expected as well as the USD/JPY just isn't up to the task yet.

The CONTEXT model for ES is even worse than yesterday with a -89.3 ES point negative differential between Es and the CONTEXT model. HUGE!

Some of the short term 1-2 min charts that needed to be moved for this move to happen are moved, but are showing some cracks, they may just be intraday or they may be as I mentioned earlier, the selling of this move in front of the F_O_M_C policy decision tomorrow.

I'll show you some charts in the next post, I just wanted you to know in this flat intraday range developing there is 1 min distribution. This is not a call to action in my view, but it is moving us closer to what we need to know.

AMZN Short Position Setting Up

AMZN is one of my favorite core short positions, the $300 area is a psychological magnet and as long as we are near it, it keeps giving set up after set up, although we had to wait months before we could take action on AMZNM, we knew it would make a break above the previous range and up through $300.

Today AMZN is setting up another great short entry, where exactly it ends up being, in this area or even better near $320, we'll have to see when the intraday timeframes line up with the longer term negatives.

Here's what we have so far and this is the EXACT SAME CPNCE{T as the FRP trade set up video.

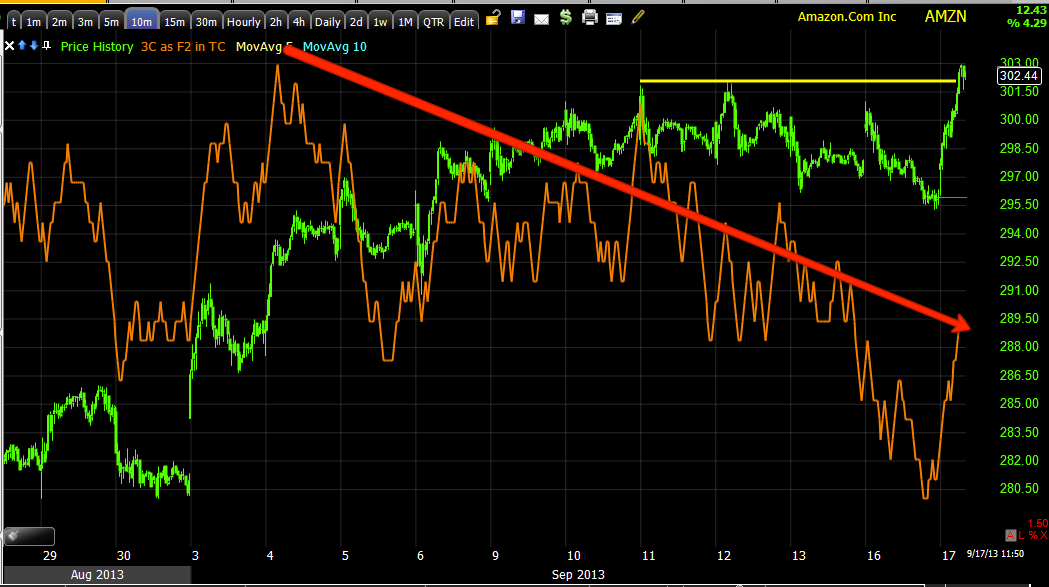
 This is AMZN moving again, I said I like AMZN > $300 and we are in that area, although I'd wait for the downside confirmation (tactical or timing) signals; the strategic signals (longer term) are there and have been there for some time.

This is the move this morning above a recent range/resistance, this is what retail will chase as a breakout and volume is up on the breakout move.

This strategic 60 min chart shows how bad a shape AMZN is in and the last place we shorted it, 3C is worse now. It's unclear whether the AMZN target was to break this range today or the last high around $310, the >$310, would be the best entry and I'd add to AMZN on that without hesitation.

The 15 min chart shows the same small accumulation for this move that I said the entire range/accumulation area in the market was for, to help stocks like this break resistance and get retail chasing them. The distribution signals are evident.

 We have distribution from 10-60 min, but the intraday 1-5 min charts are in line as they'd need to be to support the breakout move, it's when these charts go negative that we know we have a high probability short entry with good timing.

 As mentioned, the 2 min chart with small accumulation as a primer to get AMZN moving above the recent range, it's in line right now.

And the 5 min chart, despite showing distribution on the gap up yesterday, is in line now.

It's just a matter of letting these charts go negative, the market should do the same at the same time and these make beutiful set ups.

If you watch the FRP video again, this is the exact same concept described in that trade set up, that's why I asked you to watch it again until the concepts stuck because that's what we are looking for in more than 100 stocks.

Retail Sentiment Update

It wasn't that long ago that retail was as bearish as I can remember seeing them since 2009. While I don't follow a list of traders on Twitter (one because I don't have time and two because I don't want anyone else's opinions creeping in to my analysis even subconsciously), I do think it's a good idea to know exactly what retail sentiment is as it's a great counter indication.

We have a couple of members and Sam in particular whop has been with us since the start (that would be right wouldn't it Sam?) who know "who's who in the zoo" over at Twitter and they follow traders and give regular sentiment updates as the waves of sentiment in retail are much like the flocking of sheep.

As I said, just about the end of August, the bearish retail sentiment was off the charts. This was one of the first reasons I suspected we'd be seeing a bounce soon to shake up the herd. I have previously said that retail chase the market and it takes about two days of real market movement to switch their sentiment from bullish to bearish and vice-versa.

This is the sentiment update from today, just as I always talk about, Retail chasing the market...

General Sentiment:

"Odds still favor that this rally continues after any near-term pause"


"BTFD still working!"

"Hi Brandt,

I wanted to comment how funny these retail traders are on twitter.  One big observation that I made that sets us apart from them is they get swayed by every squiggle in the market and are constantly deceived by price action.  While we are sitting for further confirmation from 3c they are chasing prices up and down.  I can't imagine what a stressful way to trade that is."


GLD Follow Up (Gold)

Yesterday this update for GLD was posted , the gist of the post was that I see no reason to abandon GLD long calls from last Friday, as well as showing the very tight correlation between GLD and miners recently (GDX).

I'm not under any illusions with GLD, I think it heads to the $114 area as the sub-intermediate trend, but the short term trend looks like a counter trend bounce is very likely, thus the reason I chose GLD options, if I were to play the downside after a decent pop to the upside, I'd use something with less leverage for a longer swing trade, perhaps a 2x leveraged short, but we're not there yet.

Honestly I'm not excited at all by gold futures, silver actually has at least 1 chart that is eye catching or at least more so than gold futures, but GLD (as limited as the divergence may be-out to 15 min to 30 min) might be, it's still more than enough for the kind of move we are looking for and where gold goes, GDX is usually pretty sure to follow.

While we are in stealth, hunting mode, I'd really like to see some of these positions move so we have something going on while we're picking up the trail (scent) of the market, which I have an interesting sentiment update to share with you later.
'
 This is the 15 min chart of GLD, the trend is clearly down and I think as I  said in the last update and a week ago that GLD will move to the lower end of its range in the $114 area to gather more accumulation before making a really significant move, but this move we are looking for to the upside off a small "W"W base is called a "Counter trend rally" or bounce may be more appropriate in this case. Most of you might be thinking, "Fill the gaps", however, to be fooled, counter trend rallies have a purpose and it's not because the market is oversold.

Wall St. can only make money when they are trading against someone, it's a zero sum game, for one to make money someone else has to lose it. When you have a trend like this in gold, there are too many people on the same side of the trade so a counter trend rally mixes things up.

The defining feature of a counter trend rally is found in its need to be believable as to get traders chasing the counter trend rally, thereby giving Wall St. a chance to set up a new short at better levels and to have retail more than willing to buy up the shares offered short by Wall St., SO THE DEFINING FEATURE OF ALL COUNTER-TREND RALLIES IS THEY ARE SHARP, THEY ARE STRONG AND IMPRESSIVE.

In fact, I'd say a bear market counter trend rally is one of the strongest rallies you'll see in any market including bull markets; take a look at the DOW crash of 1929, few people notice it, but soon after the crash the first of at least 5 counter trend rallies lasted SIX MONTHS and gained +50% just after the start of the most historic crash the world remembers in equity markets.

 GLD 2 min breaking support this morning and 3C is positive on the break.

Here's a closer look, the volume was there for the stop run that is used for momentum and doing some last minute shopping at a discount.

GDX is prepared for the move too and as I showed in the post linked at the top from yesterday, there's a tight correlation between GDX and GLD. Keep an eye on these, this may be where some of our action is at today.


Keep an eye on GLD

It looks like it just made a head fake move around 10:20 a.m., this may be the marker we look for as the start of a move.

I'll update charts in a moment, but the volume was there for a head fake move.

Opening Update

As suspected late afternoon, the 1 min divergence did develop overnight as I posted in the updated futures late last night and kept going through the European session and the US open.

The initial gaps up don't look all that impressive after the Nikkei and SHCOMP finished lower last night and I don't see any thing in the way of news driving them, they just started late yesterday and my guess is today is the last day any risk on position can be taken before the market sits back and waits to see what Bernie and co. do tomorrow.

It's a little hard to judge the strength of a divergence that was formed largely in the overnight session, except to acknowledge that it had little choice but to form in the low volume overnight session, until we can see it on regular hours charts, it will be difficult to judge, but I'm guessing some time today we'll see it start to be unwound before the F_O_M_C tomorrow at 2 p.m.

Index futures overnight.

 ES 15 min leading overnight

NQ 15 min leading positive overnight

TF 5 min leading positive overnight.

So I'm guessing these will have a bit more strength than the opening implies, we'll see how the Leading indicators and specifically HY credit respond, a failure to respond is a damning thing for this new mini-bounce.

Gold and silver don't look that interested in following the market here, at least not like the Index averages look, so I'm again guessing this is a short (day or less) distraction before the F_O_M_C's main event tomorrow.

Monday, September 16, 2013

Futures Tonight Proving Afternoon 3C Charts Correct

I told you I'd give futures some time and check them, I also said it's rare that a 1 min chart holds up (divergence) through overnight trade, but why start a positive divergence so late in the day without an EOD ramp? The only reason would be if it continued through the night and thus far, NQ / NASDAQ 100 Futures are showing a great 1 min and even a 5 min positive divergence although not as impressive. TF / Russell 2000 Futures are also showing a 5 min divergence so 3C was correct this afternoon as tonight's futures bear it out.

This still doesn't change analysis, it doesn't change HY Credit dislocating from the SPX, it doesn't change the strong VIX future accumulation, it just means it's likely we see a bounce tomorrow, it might be the last day the market feels safe to bounce before Wednesday's F_O_M_C policy announcement when I think most would want to be rather flat.
 NQ 1 min positive divergence holding VERY well and a beautiful rounding bottom or "reversal process".

 You can see the 5 min chart is just starting to show this positive as well, the R2K futures 5 min chart is much more developed.

R2K Futures.

I looked at USD/JPY and while the $USD has a 15 min chart that looks strong, the 1 and 5 are not there yet so I'm guessing that the SPY Arbitrage will be what is used as we saw earlier today and in leading indicators.

Also of interest... Crude gapped down last night on the open, I said though that I thought it would chop around and guess what, there's a positive divergence there too so it should move up creating a choppy zone, down, up, down, up, etc.

Treasuries which dropped today also have some positive divergences.

Gold and Silver are more or less in line for now.

So, just what we thought at the end of the day is showing up in the overnight session, this is why patience is important, there will be a time to strike, but I didn't feel it was today yet and apparently for good reason.


Daily Wrap

I'm not sure there's much more to say except I think the lesson of today is similar to the lesson of September 13 2012, which was when the F_O_M_C announced QE3, I had more emails that day telling me "Don't fight the F_E_D", and if I were to right in my trading journal, I would have said,

"With QE3 announced today and the market's initial knee jerk reaction to the upside, I'll admit I was very tempted to close all shorts, go full long and call it a day, but those were my emotions and conventional wisdom talking, objective data said something very different, it said hold the shorts, stay where you are for now"

No, I'm not immune to emotions of a trade, but I've had enough experience to know that Wall St. often moves the market just to touch on emotions to get you to do something they want, this is why I always look for objective data. I had a lot of emails last night and this morning asking if I would bail on short positions given the gap up, my answer was, "I wouldn't do anything until I saw objective data, otherwise I'd just be acting out of highly subjective emotion and that's not good decision making in the market"

And what do you know, as soon as regular hours open at 9:30 we see the largest move down since futures opened for the week and things didn't get any better from there.

Just like when QE3 was announced and 3C was clearly negative, over the next 2 months the market drifted LOWER, not exactly what conventional wisdom would say and the market lost about 8% in to the November 16th market low when carry trades were fired up a week before and there was accumulation in to the low, so the shorts were the right move for the time and that was a hard decision because of emotions, but it was a good decision because it was based on something more objective than my fear.

So what can I add to today that I haven't already said? Not much, we say the damage and signs of it last night, this morning on the open it was immediate, it didn't get better no matter what metric you used.

HYG, VXX and TLT in the very short term along with 1 min charts are indicating a bounce higher, thus far seemingly based on SPY Arbitrage, since they are only 1 min charts I don't know if they can hold up through the night as they typically don't, there's no strength to the divergence beyond 1 min charts and in fact quite the opposite, the longer charts are very negative and not much longer, 2 min through 5 min and with confirmation in VXX as well as VIX futures and Index futures.

If I had to guess, I'd say the VIX accumulation is directly attributed to the F_O_M_C meeting starting tomorrow and the policy statement at 2 pm on Wednesday.

Some of the most damning information came from the charts (broadly speaking including futures), VIX futures as well as VXX, but the big one was High Yield Credit, as mentioned I wouldn't expect HYG to reflect the same as it is one of 3 assets that need to be manipulated to cause SPY arbitrage manipulation which is short term like the 1 min positive divergence forming in the late afternoon.

The CONTEXT ES model is simply stunning, if they don't adjust it and it's still -70 ES points negative tomorrow, I think we may have to rethink he timing of a major downside move. Still HY credit is standing out, there's no correlation with HY credit that can help the market so there's no manipulation there, that's the really disturbing part as far as the market and downside goes, the CONTEXT Es model's extreme reading of -76 points is just making that downside move scarier.

As far as the F_O_M_C, the consensus is they';; float a trial balloon and announce a gradual/minor tapering and gauge the market's reaction, I agree with that, but at the same time I think the F_E_D is in this position because they have some real balance sheet problems and need to wean Congress off infinite money printing. The further they go down the rabbit hole, the worse it is to try to come back up.

I don't have anything else to add beyond what we've already seen expect to say again, I'd be very concerned if I were long when you look at all of the market breakdowns recently, what happens when HFTs shut down and all liquidity does as well, I can see these markets breaking on a near daily basis, something is not right here and I see it as a major red flag for the market when true panic sets in.

Other than that, all I can do is watch futures tonight and see if the 1 min charts can actually hold up overnight to produce a short term positive divergence that does something tomorrow, I don't think it's much longer than that being VIX futures are being so heavily accumulated someone knows something is up beyond the 2 pm Wednesday policy statement.

We may very well get some last minute chances to jump in new or add to positions, but you can see why I wanted to wait today with the EOD positive 1 min divergences forming.

I'll update again later if the futures are acting in a way that suggests they are able to hold on to the EOD positive divergence, it's nothing to fear, it's more of a short term market gift if you know what it is, if you are just chasing price like so many in pre-market this morning, you're in trouble.


ES Futures

In similar fashion to the SPY as well as the VIX Futures wherein only 1 min charts are moving positive, obviously not enough for today, it's hard to say if they can maintain momentum with 1 min only overnight, the point still is that in addition to the market averages, the futures and VIX futures as you already saw, all confirm the same.

 Like the SPY 1 min positive, the SPX futures have a 1 min positive, the VIX futures 1 min negative is confirmation.

However like the SPY negative in every timeframe beyond 1 min as seen in the last post with 1 and 5 min charts, ES 5 min is leading negative and VIX futures are leading positive, again confirming the same.

SPY Update

Here's an example of what was seen earlier, I didn't put the SPY Arbitrage together until looking at Leading Indicators, I was more focussed on the USd/JPY as a possible engine.

 SPY 1 min intraday positive forming, as mentioned over an hour ago.

However nothing longer to support that divergence as seen on the 2 min and considering the size of the move last night, a 5 min chart "could " have easily confirmed it if it were not being sold in to, that's not the case.

Today is nothing but worse for the SPY 5 min.

I'm not adding more timeframes because I already updated the entire SPY timeframes earlier today