Monday, October 7, 2013

Opening Indications

I don't want to beat a dead horse, but the 3C directionality or signal from the EOD Friday  has been right on, we are still in the consolidation through price, however as the pre-market Index futures suggested, there's improvement to at least hold price in the consolidation and not slipping further.

 ***I will be updating Gold, Silver and miners along with their relationship to the market next as the PMs seem to fit very well with both short term and longer term trends and give pretty clear indications of what to expect fro each.

SPY...
 The 60 min SPY chart shows today's gap down remains well within the consolidation area as well as a larger than expected rounding reversal process. It looks like the final move of the market is going to be a bigger bang than the whimper I originally expected. With the government shut down, there's no economic data and that may in fact help the market.

 This was what the chart I posted Friday looked like suggesting continued consolidation whether through time or price, it's actually a little of each as you can see above.

The 5 min chart that first showed weak positive divergences in 3C the week of the 23rd with that Friday, the 27th seeing increased accumulation, and it has been leading since as the reversal process matures albeit larger than expected.


Morning Futures

Basically we are where I expected we'd be last Friday as posted last night, this is Friday's Market Report in to the close...

"My initial impressions are for some sort of consolidation Monday, perhaps just early in the day. The consolidation can be through time or price. I don't think it will last long and if there are well set up call positions, they should be at their best Monday. The reason I don't think a consolidation will last long is because the charts to support a longer consolidation aren't there, the process is mature."

And here's the SPY gapping down, but right in the consolidation zone
Take a close look at the bid/ask in red, I drew a green arrow to show the consolidation zone even after the gap down.

We usually still have a head fake move, but that may have been the Friday lows.

There's some evidence for some strengthening here to hold things roughly "in place", but this is early Russell Futures pre-market.

5 min R2K futures positive at the overnight lows.

Other Index futures are in line. Treasuries are pretty close to inline with some slight 1 min softness in the 10-year.

Gold and Silver Futures are confirming their gains, gold has a slight touch of weakness and silver is nearly perfectly in line, but I would not say gold looks weak.

Crude is getting knocked around pretty hard and I still se NO REASON that the USD/JPY will not head higher, the 15 min charts are perfect on futures so that may start later today which would be a change (positive) for the market.


Sunday, October 6, 2013

Sunday Night Futures

I really didn't have to do a lot of work tonight in examining the futures, the signals were there in 3C late Friday and as I have shown numerous times before, they tend to pick up right where they left off whether it be over night or over the weekend so the fact Index Futures are down a bit (the Financial media will tell you it's because optimism about a possible deal from Friday is now lost on the market), really the signs were there Friday afternoon as this EOD Market Update proves...

"My initial impressions are for some sort of consolidation Monday, perhaps just early in the day. The consolidation can be through time or price. I don't think it will last long and if there are well set up call positions, they should be at their best Monday. The reason I don't think a consolidation will last long is because the charts to support a longer consolidation aren't there, the process is mature."

Of course we still have about 12 hours before the open and a lot can happen, but this is just a phenomena that 3C has shown so many times that it is just a probability.

ES Futures on the open ...
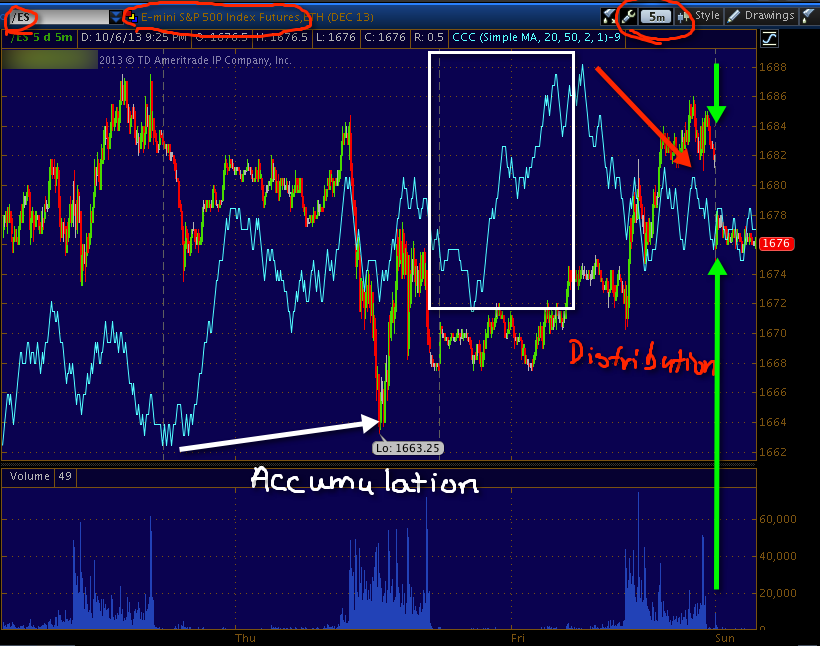
 Here we see ES (SPX 5 Futures)  min with a positive divegrence at the low and a negative going in to Friday's close so tonight's open is no surprise at all, for the rest of the analysis just see the linked EOD Update above.

Take a look at the intraday chart of the SPY Friday afternoon...
It's the same negative divegrence, selling in to the weekend / close and it will likely gap down a bit and finish consolidating. Of course any new information the market gives us cannot be ignored, but what it told us Friday was to expect something like tonight, not a melt-dwon in futures, not a straight rocket to the moon, but a continued correction and the probability of some downside in that correction.

Thus far, none of the other futures are standing out, Treasuries and PM's are acting as you'd expect with the Index futures acting as they are. Crude is down a bit, but nothing exciting.

As for currencies, I see a strong probability the $AUD loses ground from here, a m slight probability that the Euro continues on the course it's on  (corrective), short term the JPY doesn't have any strong probabilities, but at the 15 min chart (which is still pretty close to short term), the probabilities go way up that it will see downside and the $USD looks like short term (overnight...maybe a little longer) looks like a tiny bit of downside is probable, but again at the 15 min chart the probabilities go WAY up that the $USD gains ground.

THAT WOULD MEAN THE FX CARRY PAIR OF $USD/JPY IS LIKELY TO MOVE HIGHER WHICH DIRECTLY CONTRADICTS THE GOLDMAN SACHS "SHORT THE USD/JPY" CALL LATE LAST WEEK WHICH AS I ALWAYS SAY, "DO THE OPPOSITE", GOLDMAN ISN'T IN THE BUSINESS OF GIVING FREE TRADE ADVICE, THEY ARE LIKELY LOOKING TO BUY ANY SUPPLY CREATED BY THEIR SHORT CALL.

That's a lesson worth remembering because it has probably been something like the last 7 consecutive Goldman calls have all been stopped out, not because Goldman are on the wrong side of the trade, it's because they are giving misinformation so they can be on the right side of the trade while you would be on the wrong side of the trade.

****In addition, as far as short term market action (even as covered in tonight's GOOG video) a rising $USD/JPY would be consistent with a rising market, in fact it would be an engine to help the market move higher. 

If anything pops up I will update, otherwise  I'm looking forward to a great week and I'll see you in the a.m.


Hedge Strategy / Market Trade Duration & Probability Analysis

This is the video I wanted to get out this weekend to better explain what I'm seeing in numerous assets and I use GOOG as this is where I first brought it up. This makes a trend and increases the probabilities which already fit both trend expectations as well as very near term analysis as posted late Friday .

Whether and actual hedging strategy is incorporated or not is a personal choice, if there's a good set up for it, I'll likely try it with a few assets with the ideal outcome being short term long trades using leverage hedge long term trending shorts which will not only hedge the long term trade, but should raise gains via the short term leveraged traded functioning not only as a hedge, but as a trade in itself and protecting a higher, long term probability position. Establishing or finalizing this long term position is probably, at this point, pretty wise as the probabilities of a hard drop are now beyond the normal probabilities by a fairly extreme amount which I believe is the effect or other side of the coin,  that QE has had on the market. For every action there is an equal and opposite reaction, however in the market fear is stronger than green so the equal and opposite reaction tends to be more violent as it takes about 25% of the time to erase the previous action and then some in most cases.

Here's the YouTube link to the video and there's an embedded video player below.

I'll be checking in later tonight as we see what early futures trade looks like.


Friday, October 4, 2013

EOD Market Update

I'm going to try to put together that video I mentioned earlier today as this is a complex subject, but I think very timely and extremely important if you are to put to good use the information we have.

My initial impressions are for some sort of consolidation Monday, perhaps just early in the day. The consolidation can be through time or price. I don't think it will last long and if there are well set up call positions, they should be at their best Monday. The reason I don't think a consolidation will last long is because the charts to support a longer consolidation aren't there, the process is mature.

 IWM 2 min negative intraday has acted more as a consolidation through time than price.

 The 5 min though keeps making higher highs, this stops around 10 and is totally reversed at 15 mins so there;'s a cap on an upside move as well, just more room.

 SPY 2 min negative also acted as a lateral consolidation.

3 min is in line, thus there isn''t much that negative intraday to keep the market negative for long or in consolidation I should say.

Again the 5 min is making higher highs like the IWM.

And at 10 min, we are leading positive. If this move isn't ready now, well, I just don't see much more they could or would need to do with it to accomplish their goals because they aren't turning the negative 15 min and longer charts so it seems this is as far as things can go without a price move.

I'm holding everything, but will lighten the short term load as any move runs out of steam and look to keep it light as I concentrate on the trending positions.

VIX Futures Apathetic

Most of you know that the VIX moves opposite the market, if there's fear in the market of a sell-off, VIX futures are bid for protection, if there's complacency VIX futures are not bid, when this happens the assumption is (by traders) that higher prices are coming or will continue.

For us though there are two different forms of VIX information, the price itself which is all most people see and the underlying trade which is in my opinion, a far better indication.

For the VIX piece to fit the puzzle, first we have to understand what expectations are which are based on a number of individual data points, not a guess or gut feel and expectations are still for the market /  IWM (I use this as a standard because of its resistance area that would represent a breakthrough and because it's a leader of risk on moves) to make a move higher.

IWM 5 and 10 min charts as well as numerous other market averages have been pushing this way.

So does VIX data confirm?

First the VXX short term VIX Futures .
 Here we see 3C weaker than price, this happened this week when they banged the close, first VXX futures saw 3C lagging which was mentioned in a market update hours earlier, then a positive divegrence developed in the market just before the close and they ran up the market in to the close using lower VIX prices.

 Our big picture expectations are the exact opposite and when looking at a 4 hour chart of VXX, it is the exact opposite so that's confirmation of the big picture.

There are several different forms of VIX buy/sell signals using Bollinger Bands, for instance the orange arrow shows VIX prices outside the band and then closing inside, some take that as a sell VIX/Buy the market signal. I prefer a 2-day candle, the first above the band on a close and the second fails to hold and closes inside the band (yellow arrow then red), the last time it happened the VIX sold off. So far today we have the same signal suggesting (if it closes like this), that the VIX sells off and the market bounces which is in line with out expectations.

This is the most important to me, it's the 15 minute ACTUAL VIX futures chart and as mentioned, underlying trade is apathetic by way of a leading negative divegrence. To me this suggests that smart money knows something that most don't, especially with protection not being aggressively bid in to an unsure weekend.

As far as I can see, the VIX is confirming both expectations, the strategic and tactical.

AAPL Should Bounce

I'm not very excited about AAPL long, I think it needs leverage and even then I'm not so excited as to open a position, but I think by putting together individual pieces like XOM, AAPL, etc. along with the Index Futures and market averages, we get a composite of what should happen and we can take advantage of that, but at this point in the game I think it's more important to be looking ahead to the positions that will carry your portfolio to profits over the next year or...

That said, AAPL is not on my core short list.

Earlier today I was not impressed at all by AAPL, but it has made some progress as we near the end of the Friday op-ex pin around the last hour of trade, things usually move a bit more.

 intraday charts are starting to look better.

It was important for this 5 min chart to hold up as without it, a call is not worth the risk.

And along the lines of the IWM 10 min or SPY/XLF 15 min, the AAPL 10 min has a positive enough divergence to believe in a move to the upside, I'd put the target in the $492-$495 area.

XOM Trade Set Up

XOM was first a core short that was closed because it was clear a counter trend bounce was coming, but I'm still looking forward to re-establishing XOM as a core short again at higher levels which I think is probable. It has also been a decent call position since the first call on the same day I covered the core short.

 The red "C" is for a closed Call position, the white "C" is for a call opened and the red "S" is where the core short was covered and each has their gains above for the position, +5%, +39%, +32% and a current call open now.

I like XOM for a call position, I don't think it has enough profit potential for an equity long, but you could always use ERX (3x long energy ETF) which I mentioned the same day the call was opened, I think that position would be worthwhile.

 This daily 3C chart shows why XOM is near the top of the list for core short positrons and why I will re-establish the short equity position at higher prices.

The 2 hour chart shows distribution at the July top and a small divergence now suggesting more upside on the counter trend bounce, although there is no real primary trend yet other than lateral.

 The 30 min chart's negative and positive as well as the reversal process in orange, it looks like a call in XOM is well worth the risk even here.

However if there's any chance to get a call opened at lower levels (in red), that would be my preference.

You can see the short term opportunity pretty clearly, when looking at the daily chart you ccan see the long term trending trade opportunity very clearly, so I'm just trying to take what the market is giving here, but in doing that I'm also executing my main strategy, ride XOM up with a call to make some gains, but the most important thing for me is to re-enter the trend position short at higher prices.

I think we get higher prices, but I don't think they hold for long.

Market Update - IWM

First, intraday here's the TICK chart, it's clearly going negative so intraday we are definitely toppy here.

 This is my custom TICK Indicator, it's like MACD, but instead of using two moving averages, it uses the linear regression of the SPX vs. the linear regression of the TICK. The TICK should stay strong on a move up, here you can see more and more stocks are refusing to move higher so the intraday breadth is coming apart.

This is the R2K Futures 5 min chart which is positive, I showed it several times this week and last night.

This is a big part of why I think we get another leg up and that fits with the expectations as well as I have expected the ascending triangle in the IWM to see a breakout, that's where I think we see a lot of very heavy distribution, not to say we don't already have that. What I'm saying is the ascending (bullish) triangle isn't there by coincidence, this in my view is part of a set up cycle to accomplish a goal, to get retail bullish and provide Wall St. with demand to short in to, a breakout above such an obvious ascending triangle would go a long way towards that goal. By the way, this has been our view since we saw the triangle forming.

 IWM 2 min intraday losing 3C.


the 3 min chart is as well, I drew is a rough pullback, I'm not predicting targets here, just giving an idea of what I think is most likely to occur.

On the 5 min IWM chart I'm trying to show how much accumulation I believe there was for this cycle and how much distribution we are seeing roughly which leaves room for another leg up as the real distribution target is a break out above the triangle where retail will chase it.

In a moment though I hope to show you how insignificant this is to the big picture. I've said this before and I still believe it, "We are not 'near' the big picture, we are well within it".

This 10 min IWM chart shows the ascending triangle and the current action, again I drew in a pullback which I think is starting now and another leg up which is the breakout above the triangle.

Again, this is important for near term trade, it's tactically important for longer term strategic planning, but the price move itself is insignificant in the larger view of the market.

At 15 mins, there's a clear distinction between the last 10 min chart and the leading negative of this 15 min chart. In other words, the market is already exceptionally fragile right now. Again I drew in what has been my expectation, this is nothing new.

Looking at a 2 hour chart of the IWM, the very strong leading negative divegrence and what could be a H&S top, but I think more likely will be a broadening top. If you follow the red line I drew, that slight jiggle to the upside is what the breakout above the ascending triangle would represent to the larger picture, again it's insignificant as far as price, but it's very significant as far as strategic planning and tactical execution of core short positions.

Quick Market Update

Intraday we look to be getting toppy here, I would say we are on the edge of an intraday pullback.

However, I believe after that we'll have another leg higher, whether it can put that leg together today or not, well I doubt it with op-ex and all.

I'll post some charts, but if you just recall the IWM futures and the others from last night, they are more indicative of that next leg higher, but at the same time that next leg higher needs to be used in my view for long term shorts/core positions.

I'll get some charts up next.