Thursday, October 31, 2013

AAPL Set Up / Follow Up

One of the things that differentiates a pro trader from a retail trader is tenacity, I won't quote him right now, but Jesse Livermore (as in of the book by his name, "World's Greatest Trader") alluded to this in one of the best pieces of big picture advice I've heard. He also went broke like Donald Trump several times, Tenacity.

A pro will take several shots at the same trade until they get the positioning they want whereas amateurs or lets say "non-pros", will take 1 sot at a trade, usually take too big of a loss and walk away from the trade idea and subconsciously they'll even avoid the stock again in the future or they'll be fixated on it like they'll get revenge. I'm not knocking it, I'm just saying it's human nature. A pro can take several shots at the same position because they keep their losses small.

I've found more often than not you can be right about a stock or a market and the difference between making money and losing it is all on the tactical side, the entry and exit.

So yesterday I closed the SECOND AAPL Dec. $535 put in as many days, the P/L for this one (the last was slightly above break-even) was...


2 contracts at a cost of $27.20 each (remember I said I wanted to leave room to add just in case) and the exit was $27.95 for a slight gain of +2.75%, but I didn't close it for that reason.

I didn't go for a regular equity short because I still have some concern with the longer end of the charts, 30/60 min which had been perfectly in line, the 30 min and even 60 went negative at the recent high as you can see above on this 30 min, this makes me more comfortable with an AAPL short, but I'm not yet comfortable with an equity short, but a shorter duration leveraged trade, Puts, yes and that's the entry I'm looking for possibly today (for a 3rd time).

 AAPL accumulation and distribution- 30 min

The 15 min chart shows what looks like a reasonable reversal process, but this is only part of the uptrend, it's fine for a quick options trade, for an equity short, as I said, I'm not sold yet.

This is what makes me think AAPL has a shot at higher prices and why I didn't want to sit in a put during that, there were smaller signals yesterday, but ultimately its a 5 min chart, it's below resistance, it's a head fake move, volume is there, it did what it should have done so they can take this higher (form where it is now, I'm not making predictions about how high, I'll let AAPL/3C tell me that).

So that's what I'm looking for in AAPL. I'll let you know of course as always before any entry or exit, but I am really NOT sold on an equity short and really I'm looking only at the trend above this chart so duration is not especially long, thus the need for leverage.


Market Update- Looking for that "In"

Yesterday toward the late afternoon some positives for a bounce like move were building and that's mostly what I'm looking for today to set some new positions. Most all of the trading shorts set up in the last week are at a profit now, not huge, but we're just getting going.

The thing I'm worried about is any small divergences that appear can easily be run over by momentum, the reversal process is mature as you can see in the IWM, actually over-ripe in the IWM.

 That is MORE than enough of a process and I think the only reason it was so long was waiting on the F_O_M_C.


Momentum is not on the side of a bounce, my Russell 3000 Most Shorted Index (red) vs the R3K is showing a lot of downside momentum.

The NYSE intraday TICK is at extreme s of -1750!!! We haven't seen that in a LOOONG time.

What I do see that "may" allow for a toe hold, so we can set shorts in to a bounce is the Yen, it is losing upside momentum and reversing which gives the carry trades a chance, I don't know if they can compete with the momentum, but I suspect this is pack-like early fear finally building in as the longs are so margined out.

I'd watch the NYSE TICK and look for a positive trend change, I'll be watching 3C and otherwise just managing shorts that were already established (both trading and core), but there are a few I'd like to take a swing at.

AAPL is one, XOM was a core short that I closed and went long for a counter trend bounce, at some point that's going to be a short again. There are others, but first we need a little improvement in atmosphere (to enter new positions), otherwise I'm quite happy about the core and trading shorts.

Keep an eye on that TICK, it's amazingly extreme.

A.M. Observations

I've been looking at some of the data/charts overnight and checking, re-checking just to make sure I'm not overblowing some bias I may be unaware of as we all have them from time to time, but it benefits me nothing to be right about a bearish case over a bullish case, it only benefits me to be on the right side of the case for you. If that means I have to eat humble pie and admit mistakes, I'm okay with that, I'm human, I make them and probably have a fair share, but the bottom line is the weakness I see is unparalleled and its a difficult discussion to write about succinctly as years and years of bias about how Wall St. works have skewed our thoughts, so it's not just presenting evidence, but in many cases it's starting from ground zero in explaining how Wall St. works (underlying trade) and why in some ways, this time is different, but not in a good way.

I think you all have seen the dismal volume since 2009, you know the record margin, you may be aware of who provides liquidity and that they are not bound by law to do so like a market maker or specialist and they can pull the plug in an instant and seemingly have recently. I'll try to get more in to this as I have more time and try to think of ways to make it as succinct as possible.

Futures for all the overnight action are virtually unchanged if not literally from the 4 p.m. print yesterday.

China is conducting open market operations and putting reverse repos in to the system, but with a twist, a fixed rate higher than usual which gives the impression they are managing a tightening patch, it's not over as we might have assumed when they started reverse repos again this Tuesday.

Japan's Abenomics are creating inflation that he wanted, but like the US, in Food and Energy, the two places it really hurts every day citizens while wages in Japan have fell for a 16th straight month.

In Europe German Retail Sales posted a huge miss.

In the US, Initial Claims misses.

Right now though, the most important thing for us near term is planning and execution of positions while maintaining a finger on the pulse of the macro market, I don't think it will change as I haven't seen much like this except in a few Industry groups like Oil under G.W.B. and there's a reason for that which I'll get in to, but right now, I'm more interested in making this information useful.

Gold has been pulling back overnight which is exactly what we had expected with it being a buy at some point as we get positive signals. Crude is a bit jerky even as the USD is rising, also another recent expectation. All of the carry pairs are useless today for ramping the market and I think that overnight strength in the Yen is the obvious reason why so they may try an arbitrage end around, but I suspect protection will be bid making that hard today. We'll see how long the Yen can stay up.

So lets see what's on the menu...


Wednesday, October 30, 2013

FB as a Barometer

Well I knew there was unusual accumulation in FB very short term and heavy distribution very long term, but I didn't think my comment from earlier...

"At first FB had some pretty nice intraday charts, they look better than the overall market, however as I got to longer charts, the damage there was obvious. FB may be good for a rip and dip, but it's just not strong enough for me to take on as an earnings play."

Would play out so fast...
FB ripping and dipping in AH alone.

The market is much weaker than I've ever seen it. I think we are at a pivot that is not only important to the 10/9 cycle, but the entire of 2013 and even bigger, likely the entire 2009 through present.

I'll get in to more detail when I don't have to rush through it, but the essential plan remains the same, there was some short term divergences toward the EOD, I think we are best off using these to short in to whatever strength is left as retail seems to be firmly holding the bag based on the market's actions today, only later did it seem smart money stepped in to set up what looks to be a very small cycle, thus me closing the AAPL Put again, I'll give you the P/L on that position tomorrow, but it was another small gain, but the gain wasn't the point.

Hopefully we'll get a shot in stocks like FB, but what I saw after hours tells me a lot of things we have been seeing are firmly in place and it's not going to be good for the market. 

The days of buy the dip and "Aren't we smart" are fading fast, you'll need an edge and be able to track like a hunter, like a wolf, I think not only do we have that, but the reduced liquidity environment will actually make it easier for us.

I have a lot of other thoughts I'll share with you, but mainly I'm saying I think the pivot we are at is more than just a reversal from the 10/9 bounce, a lot bigger.

I'll see you in a few hours, THE PLANS FOR NOW STAY THE SAME...

Stay patient and let the trades come to you, there are plenty and you have time.

FB After Earnings & a Note

* First let me mention that the Daily Wrap will be a bit later tonight as I have a Board meeting to attend, but basically what we have been seeing is there. There's a major break and while I don't want to repost all of these charts that have been posted a dozen or more times over the last week showing all the details as you know what they show, to summarize I'll get in to some of the ins and outs, why and why not. Essentially the strategic break is huge, it's there, but I closed AAPL puts because of tactical concerns, I left the less leveraged shorts open because I'm not concerned over tactical issues with 2-3x leverage, many of which have remain unaffected even as the market went higher.

I'll get to that later, first though I wanted to go over FB as I saw it a bit before the close and the short term charts looked like something was up, in fact my terminology was,

"At first FB had some pretty nice intraday charts, they look better than the overall market, however as I got to longer charts, the damage there was obvious. FB may be good for a rip and dip, but it's just not strong enough for me to take on as an earnings play."

One quarter I wanted to show that there were earnings leaks or at least somehow smart money knew, it wasn't widespread, but it happened. So we took a quarter and I looked at just about every major company reporting, I can't even tell you how many charts, but of all of those I believe it was 22 that were selected as earnings trades as they had signals jumping off the charts that just couldn't be ignored, our hit rate was about 90+% on these, however don't forget that these 22 or so were only a fraction of the hundreds, maybe thousand+ I looked at.

FB seemed to have something that looked like a leak because it had been sent down where it could be accumulated cheaply very recently and the accumulation (all short term, not positional) was way above what I was seeing in the market in general. However I have very strict standards for earnings plays because they are such a wild card, I thought FB would likely rip which it did after earnings and eventually dip so it will be the Dip trade (the longer trend trade) I'll be watching for.

This is the kind of behavior that looks like an earnings leak, even though it's only a 2 min chart, for one the stock acts different than the rest of the market and in coming down off the 10/18-10/21 highs, the lower prices give those in the know a chance to buy a larger position on the cheap. 

That leading positive divegrence is a lot more vertical than most, so it looks like there was a very strong push to accumulate FB, still there's not enough time for this to be positional, it's short term trade, like earnings.

The 3 min chart also doesn't look like much else in the market, while everything else is seeing distribution and leading negative divergences, this chart is at odds with the market as a whole, that's a common marker in leaked earnings.

 This is where the longer term (beyond an earnings rip) trouble is, this is very much in line with the market on a 4 hour chart so that's a significant signal.

 The hourly chart is showing trouble too, it's not as bad as it could be and I'd imagine any upside in FB off earnings will see this chart turn to more distribution as they almost always are selling in to demand and higher prices so this chart makes even more sense after earnings.

The same can be said for the 10 min chart, it shows the accumulation period (not earnings related) and the in line trend confirmation and a relative negative divegrence, but it's not in the same kind of trouble as say the IWM, that means higher prices over the next "X-days" are very likely to see this chart deteriorate badly as well as higher prices are distributed in to.

That's where we want to look for a longer term trending entry, at higher prices on deteriorating charts, the same as we want to buy pullbacks showing strong accumulation as I suspect gold will do as it moves lower.

FB is on the radar. I just hope FB can hold prices long enough to see these charts deteriorate, I'll get in to that a bit too, but it has its roots in last night's late post on Hedge fund activity.

I'll be back later tonight after my board meeting and wrap it up, but I think for the most part everything is looking pretty clear between the massive negative divergences and the very short term positive toward the EOD.

Trade Set Up: Transports

Transports have been strong lately, some say because of lower oil prices, however I've seen transports too many times used to prop the market up.

I mentioned in the Daily Wrap last night that Transports are starting to show cracks and are going to end up being a nice short.

Lets take a look, I suspect the general tone of transports is probably not too far off from general market (Dow Theory as antiquated as it is with Industrials and Transports).

 This is the DJ-20 (transports) daily chart, there's been a strong trend, earlier we had a much more bearish looking candle, but the volume just wasn't there, I suspected it wasn't going to stick.

The back of this trend looks to be clearly broken, this 60 min chart shows the distribution, as far as confirmation...

The same in the 30 min chart

The intermediate 10 min chart and here's where it starts to get interesting...

The 5 min shows a good timing turn, however I suspect this will go positive to make 1 more run, perhaps a new high or just a larger rounding top. Here's why I suspect that...

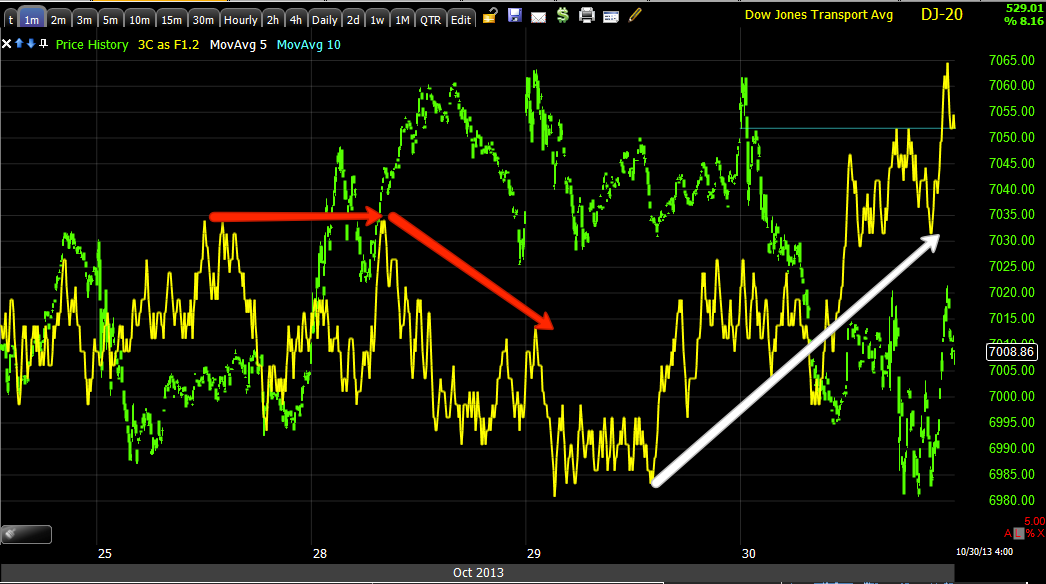
New divergences will always start on the fastest charts, here the 1 min chart today is leading positive off the lows after having gone negative and dragging down price.

Here we have the same on a 3 min chart, it may move to the 5 min, but overall the longer charts are what matters.

Strategically Transports are set up for a decline, from here we just need to look for a tactical entry. We should see a move higher in transports based on these intraday charts, it should be a short term move and because we already have such large negative divergences, we should see these intraday charts go negative on a move higher, that's where we want to enter.

That could be a bull trap above recent highs or it may be in a larger rounding top, but I suspect a higher high and that's where I'm setting my alerts. IYT would be my choice for a short, I'd keep this on the watchlist because it's close and it looks great.

Looked at FB for Earnings

At first FB had some pretty nice intraday charts, they look better than the overall market, however as I got to longer charts, the damage there was obvious. FB may be good for a rip and dip, but it's just not strong enough for me to take on as an earnings play.

Closing AAPL Dec. $535 PUT

I hate to do it again and I'm leaving all 2-3 leveraged shorts on, but I just don't feel right about AAPL just yet, maybe a day or so, I'm just not taking the chance, basically exiting at break even again.

PCLN Update and Example

The last update for PCLN was this Monday as I saw somethings last week that grabbed my interest, here's that update, you might want to check it out to see what our expectations were and how things have developed since then.

I'm just going to jump in to the charts and show you some of the expectations from the last update and where we are.
 This is the daily PCLN channel and a few breaks with normal behavior after the upside breaks, then a downside break on some volume, this use to be a short sellers signal, either here or on a test of the bottom of the channel that broke (former support) and they'd be looking for that to act as resistance. 

I almost always expect a move back inside the channel as a shakeout move before any serious decline will take place and although it wasn't the biggest break, there seems to be a LOT on interest in shorting PCLN.

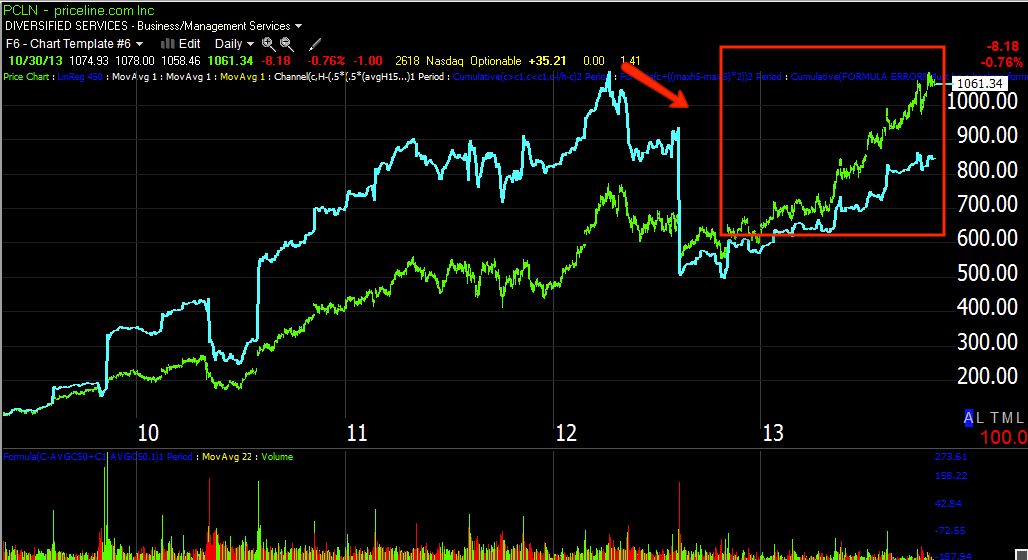
As for the money flow or underlying trade, MoneyStream shows an area of ditribution in 2013 and actually a bit before.

The daily 3C chart shows distribution in 2013 and also a bit before.

The 30 min chart shows the same triangle that was forming earlier this week, volume looks right, it's a symmetrical triangle.

For technical traders a sym triangle has no inherent bias, it depends on the trend immediately preceding it which was an uptrend so it is expected to be a consolidation (sideways) / continuation (up) price pattern.

You may recall, my thought and alerts are set for a head fake move out of the triangle and above $1100 and its that area I want to look for the tactical short set up as it's a better entry, lower risk and if distribution is confirmed on $1100 which is a psychological magnet, then we have a head fake and high probability timing as well.

There could be a shakeout on the downside of the triangle which would probably get a little short squeeze to help it move up once they were caught , but so far today it has held right at support. Ultimately expectations were for a move >$1100 setting a bull trap and down she goes.

 The 60 min 3C chart shows crystal clear confirmation on the uptrend and then very clear distribution at the red box.

 The 15 min chart has more detail, but still good confirmation on the uptrend and clear distribution in to the triangle area, the only thing it's really missing from being a text book short is a bull trap / head fake move.

This is the 3 min 3C chart leading negative so maybe we see a shakeout below the triangle, if shorts jump in and prices move above the triangle's apex, they'll start to cover and that will give PCLN a boost, once it hits $1100, retail "Should" take over and do the work from there, but they are less and less in the game it seems or perhaps it's that they are some of the only ones left in the game.

I intend on leaving alerts in place, I'll pout one for a break under the triangle and a break back above its apex just in case, for now I'm still looking for $1100, but I think even with a strong stock like PCLN you can see things are coming undone, I just don't want to say this is it, this is where it all comes undone because there's some unfinished business here and there.

By the way, the Trend Channel Stop is at $1,000, how convenient is that? Can you imagine the stops at $1000?

All of Our Positions Are Moving the Right Way

This is a bit strange, sometimes it takes a goof 30-60 mins. for a knee jerk trend to get together, sometimes it's over by then. The initial move on the F_E_D release was right to VWAP...
ES 1 min chart moving to VWAP right after the F_O_M_C and then down.

We expected the $USD to bounce, it is up, we expected Gold and gold miners to see a pretty significant pullback and they are both down. As you know I've been looking forward to buying TLT at $100-$102 and even opened a TBT (2x short TLT) expecting the pullback, TLT is down, the TBT position is up, as far as the broader market, down as the signals have been showing.

It's way too early to make any kind of assumptions, but I am kind of breathless that every asset we thought would move in a particular direction based on 3C charts is now moving in that direction.

I'm going to try to check breadth and see if there's anything to this short term