The last update for PCLN was this Monday as I saw somethings last week that grabbed my interest, here's that update, you might want to check it out to see what our expectations were and how things have developed since then.
I'm just going to jump in to the charts and show you some of the expectations from the last update and where we are.
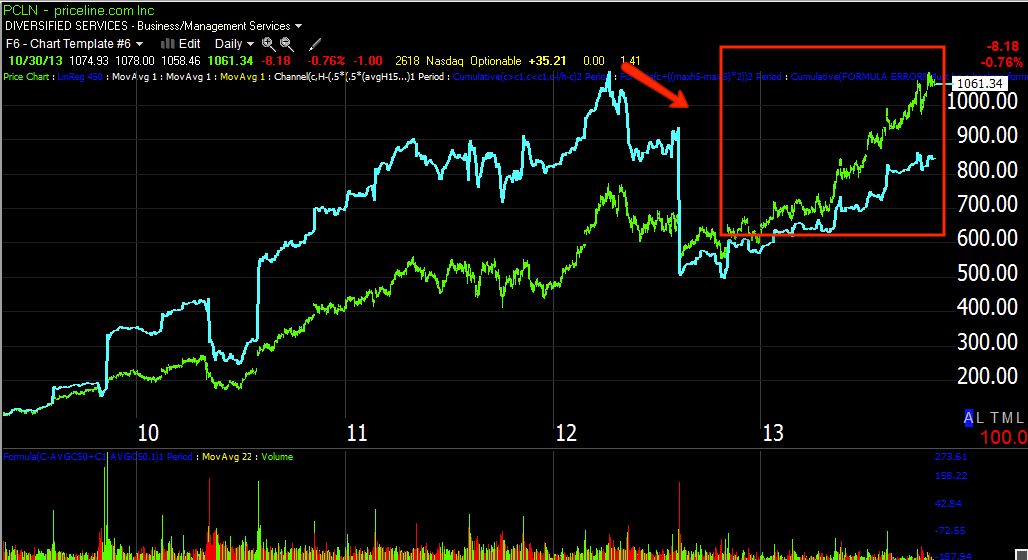
This is the daily PCLN channel and a few breaks with normal behavior after the upside breaks, then a downside break on some volume,
this use to be a short sellers signal, either here or on a test of the bottom of the channel that broke (former support) and they'd be looking for that to act as resistance.
I almost always expect a move back inside the channel as a shakeout move before any serious decline will take place and although it wasn't the biggest break, there seems to be a LOT on interest in shorting PCLN.
As for the money flow or underlying trade, MoneyStream shows an area of ditribution in 2013 and actually a bit before.
The daily 3C chart shows distribution in 2013 and also a bit before.
The 30 min chart shows the
same triangle that was forming earlier this week, volume looks right, it's a symmetrical triangle.
For technical traders a sym triangle has no inherent bias, it depends on the trend immediately preceding it which was an uptrend so it is expected to be a consolidation (sideways) / continuation (up) price pattern.
You may recall, my thought and alerts are set for a head fake move out of the triangle and above $1100 and its that area I want to look for the tactical short set up as it's a better entry, lower risk and if distribution is confirmed on $1100 which is a psychological magnet, then we have a head fake and high probability timing as well.
There could be a shakeout on the downside of the triangle which would probably get a little short squeeze to help it move up once they were caught , but so far today it has held right at support. Ultimately expectations were for a move >$1100 setting a bull trap and down she goes.
The 60 min 3C chart shows crystal clear confirmation on the uptrend and then very clear distribution at the red box.
The 15 min chart has more detail, but still good confirmation on the uptrend and clear distribution in to the triangle area,
the only thing it's really missing from being a text book short is a bull trap / head fake move.
This is the 3 min 3C chart leading negative so maybe we see a shakeout below the triangle, if shorts jump in and prices move above the triangle's apex, they'll start to cover and that will give PCLN a boost, once it hits $1100, retail "Should" take over and do the work from there, but they are less and less in the game it seems or perhaps it's that they are some of the only ones left in the game.
I intend on leaving alerts in place, I'll pout one for a break under the triangle and a break back above its apex just in case, for now I'm still looking for $1100, but I think even with a strong stock like PCLN you can see things are coming undone, I just don't want to say this is it, this is where it all comes undone because there's some unfinished business here and there.
By the way, the Trend Channel Stop is at $1,000, how convenient is that? Can you imagine the stops at $1000?


No comments:
Post a Comment