Thursday, January 2, 2014

Market Update

Not much has changed since the last market update except the SPX has had a bit more time to create something more sustainable, still in the neighborhood of an intraday move, sort of reminiscent of Tuesday's call a couple of hours before the close that they were building the market out for an end of day ramp, which actually was used to distribute in to, but the point is the duration of the move.

I compare the SPY vs the 3x Short SPX, SPXU here.

I don't see any cause for taking any action even in a trading portfolio unless you were an aggressive day trader. So I see no compelling reason to move or change anything, maybe a hedge, but even there I'm not sold. This may be an opportunity to manage MCP today, but we'll see about that.

Take a look for confirmation and perspective, remember that SPXU is the inverse or SPX bear ETF with 3x leverage, so the opposite of the SPY/SPX.
 SPY 1 min intraday, a more rounding shape, a process and a positive 1 min divergence.

The SPY 15 min is more important to me at this point than a 1 min chart. There's a negative divegrence to the far left that killed SPX upward momentum and threw it in to a range, then we had that spate of F_O_M_C, Quad Witching, Window Dressing, and year end performance and tax trades.

The leading negative 15 min divergence from this week is the standout feature and confirmed, this is a new leading negative low and what's interesting is that it's reading more distribution on a much heavier volume day than before today, so kind of serious.

The SPXU (3x short SPY) which is an open long that was added to Tuesday, right in time to catch today's move . The intraday accumulation is apparent at the EOD trade in which the market ramped Tuesday and saw distribution in to the closing ramp, SPXU confirms by showing accumulation in to the opposite move of the ramp, a decline. Intraday though we have a 1 min negative here confirming the SPY.

At 5 min we have a clear process, a large reversal process, excellent 3C signals through the process, even that chimney in the right spot.

Comparing 15 min charts, SPXU has a long term positive divegrence starting with the initial divergence and adding to it at the yellow reversal process, Again of note, just like the SPY hitting a new leading negative low on the same timeframe, the inverse SPXU is hitting a new leading positive high on the same timeframe, this is excellent confirmation.

All things considered, right now I see no reason to change anything as far as the short positions in the trading portfolio, there may be some interesting things for longer term core shorts like the BIDU's of the market and maybe some other minor management tweaks, but I'm very content to be still here and just keep observing, looking for opportunities and keeping an eye on the character of the market.

Market Update

Although 3C is going to take a little while (depending on the timeframe) to readjust to the heavier volume, it seems like there's an intraday positive divergence or two here and there, which is not unexpected, in the first post of the day I mentioned that it's still very early, not that this means the market action is any better, it's just typical to have a couple of different intraday trends through the day rather than 1 solid trend. Remember the three trends are up, down and lateral, last week we saw some days with early upside or gaps and then lateral, the last trading day of the year we had the tightest trading range in more than 6 years in SPX futures.

I'm just keeping an eye on everything and seeing what the new year is bringing. With Window dressing, because of the t+3 rule, they can add positions that have done well and look smart even though they may have only held them a day out of the entire year, it still pops up as a holding and this is why Window Dressing" is called the art of looking smart. However in many cases there can be an adjustment as early as today, perhaps they feel that stock that performed so well and want to make it look like they picked it, actually looks to be toppy, then they can sell it and no one will be any wiser until the quarterly SEC filing comes out and that can be 30-45 days later than the filing deadline so always be very careful of trading off the quarterly reports as many traders do, by the time they see what's in the report, the fund has often changed holdings dramatically so they are trading off very old information.

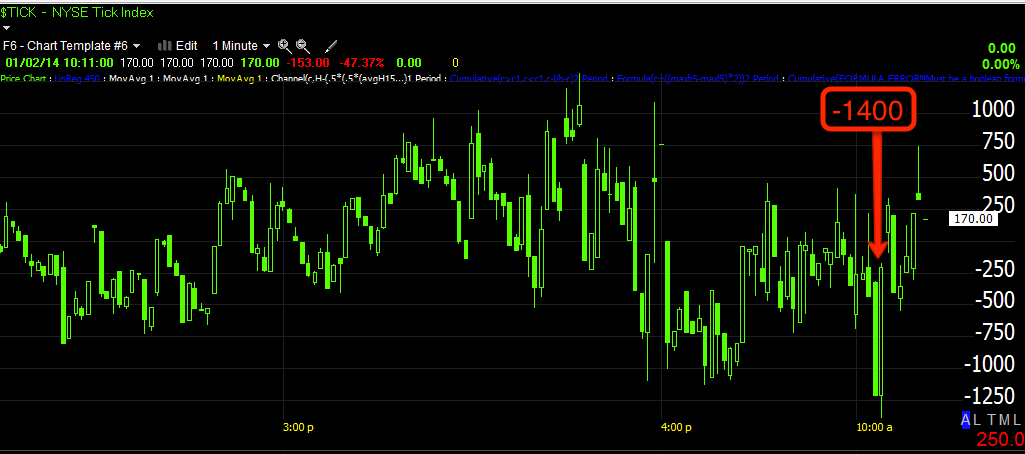
NYSE intraday TICK is one of the more useful tools today, you can see a bit of a trend change taking shape intraday, although again this chart itself is very early so I'm not jumping to conclusions.

 The NYSE TICK shows a clear downtrend channel, but recent readings are in the upper range of that channel.

The intraday 1 min SPY has a positive divegrence, but not much of a reversal process even for an intraday move, so it will take some more observation.

The3 min SPY is very clearly negative in to the ramp  from Tuesday as it was pointed out in preparation hours before the actual ramp, but otherwise we have downside confirmation of in line.

I see some intraday negative in short term VIX futures (VXX), but not much in HYG, so it's not looking like an arbitrage play.

really all that seems to have happened is the rising Yen has lost upside momentum and that means the EUR/JPY lost some downside momentum, so far kind of a stutter step.

Nothing really too interesting to see here in this regard so far.


MCP Follow Up

Tuesday I took half of the MCP long off the table to protect profits and hopefully re-enter at a lower price on a pullback, I still love MCP as a long term long position, but just needed to trade around some pullback signals. However as a core long, I'd leave it as is and just be patient.

We now have more than a 25% gain in MCP and another near 6% today, but I don't regret taking half off the table, I left half on for this very reason.
I think probabilities are mounting for a pullback, which should be a healthy event and an opportunity.

Here are the charts and you can see why...
 The long term 60 min chart is beautiful, a great base and strong accumulation right where it should be and likely Goldman is behind it. However a very parabolic move with gaps and more.

1 min intraday shows a small late day positive divergence and the gap up that is now in line this morning, however...


 The 5 min chart shows the accumulation that started this move and now the negative signal suggesting a pullback, nothing bad, nothing unusual, just what a healthy stock should do.

The 10 min shows the same, it's hard to justify not taking some off the table in a TRADING account, as for a long term trend account, leave it alone, when you try to get too fancy you just drive up transaction costs and the chances of missing a big move.

The X-over Screen has posted 3 confirmed long signals and a breakout from a trading range where accumulation was heavy. In this case, the most likely scenario is a pullback to the 10-day yellow moving average as that is what typically happens on a new X-Over signal.

You can also see (as of now), today is forming a Evening Star bearish reversal candle that would fit with a pullback so... I MAY TAKE THE REST OFF THE TABLE IN MCP (TRADING POSITION, NOT THE CORE LONG POSITION).

I'll let you know as I keep an eye on it, but those gaps with those divergences are likely going to pull price in to them where MCP should be an AWESOME NEW LONG POSITION or an add to position, we just need to see accumulation on a pullback, but judging by the longer charts, that's 85% (conservatively) likely.

Happy New Year

It looks like everything we saw this week, last week and the entire year to a larger degree is seeing some real discounting once we got past window dressing, quad witching, year end performance, etc.

Tuesday's bet to take off the long AAPL hedge and add to the partial trading positions SPXU (3x short SPX) and FAZ 3x short financials, really is paying off, the signals seem to have been right on track.

Even though the VIX short term futures were pinned at the end of the year, 3C did a good job in picking up on the accumulation despite the pin of price.

Last night I saw most of Asia was in the red and knew that despite the VERY strong seasonal bias of the first trading day of the New Year, it looked like we were going to be fine with Tuesday's quick repositioning to shorts or at least filling them out and removing long hedges, a near perfect 1-day trade in AAPL that added to the trading portfolios gains while protecting the shorts there.

It seems that it's not the Chinese PMI (official) that came in a bit weak, it's certainly not the Eurozone unchanged print from their Flash print in Manufacturing PMI  which was in line with expectations, I think it's bigger than this. One of the themes I said to be on the lookout for was the cover of the carry trade. (The Carry Trade is a way that funds can leverage their Assets Under Management "AUM" by selling (
in this case) the Yen and buying a higher yielding currency like the EUR, but when a carry trade goes against you, it hurts as leverage is often at least 10:1, quite often 100:1, a few pips can be disastrous) The reason we have been watching the carry pairs is to see if and when the larger funds start moving out of their leveraged positions. The process usually goes something like this, sell the asset that was bought on the leveraged carry trade, then to close the carry trade sell the first currency of the carry pair, the Euro or USD in this case and buy back the second of the pair, the Yen. So a rising Yen as we have seen 3C signals suggesting and as we know BAC already covered part of their carry, most likely means the carry is being covered which typically means the assets bought (stocks) with that leverage are sold as the leverage is no longer going to be there).


Take a look at the Yen.
 15 min Yen single currency future is just one of many charts showing accumulation which is most likely the covering of the carry trade, a risk off event.

 The result, the algo ramping EUR/JPY is in free-fall as is the USD/JPY.

 This is the intraday ES/SPX futures chart with a significant gap down ion a negative divegrence, remember I said 3C divergences, unlike price, most often pick up right where they left off whether yesterday, over the weekend or on the new year.

 The longer term Index future charts were telegraphing this, such as the 60 min ES chart as these rarely see the same migration of a divergence like the averages do so this was important and pointed out numerous times over the last week or so.

Although they pinned VXX as part of the SPY arbitrage to hold year end gains, it didn't mean that there wasn't a healthy bid for protection under the surface, it's just price can't tell you that except by relative performance, 3C can tell you that and it was telling us, thus we went short the day before what has historically been one of the most consistently bullish days of the year, the first trading day of the new year.

Here the TICK chart breaks out of last week's +/- 500 range and hits an extreme of -1400 this morning.

However, this is no time for a victory lap, it's early in the day and we have pretty much a full staff back on Wall Street so we need to be paying attention to underlying trade, but so far so good, the Trading portfolio that is just under a month old since inception now has a +22.5% gain, blowing away the average hedge fund performance for the year of 6% and we're not charging a 2 to 3.5% management fee and a 20-50% performance fee before taxes meaning if the hedge fund makes $1000 for you their performance fee (depending on their high water mark) can be anywhere from $200 to $500 of that $1000 they made you and whatever you have invested with them, say $100k sees a deduction of $2000 to $3500 as a management fee no matter what their performance, but it's highly unlikely they'd even accept you as a client (even if you were qualified) with only $100k.

More soon, I hope EVERYONE had a safe and very happy New Year, now lets make it a PROSPEROUS ONE! 

Tuesday, December 31, 2013

Oops Was that a late day smack down?

NYSE TICK -1000

Last Market Update of the Year

And why not end it with the same garbage they've been pulling all year, except in this case, on this kind of volume, this is REALLY pathetic, no wonder VIX futures are being accumulated so heavily.

So the last update I said "I think I thought I saw and End of Day ramp coming..."

That was based on the VXX intraday action which now looks like this.
intraday negative at the afternoon session

However, they got fancy  or desperate and threw HYG in there too.
 HYG recent positive

Which creates an arbitrage for about the only traders still operating, non-carbon based...
Allowing the SPY to do this, even though it's leading negative in to the afternoon.

I'm seeing TICK pick up a bit, but it has been super thin as you'd expect.

Index futures broadly have all deteriorated whether that be 1 min or 5 min charts today. Speaking of which, I see ES just made the afternoon ramp high.

Sentiment is BROADLY down. VXX is easily outperforming the SPX correlation and High Yield Credit, well it could care less what the market does this afternoon, it's not going along for the ride. In fact, the last several days it's been headed in the opposite direction and that's just several days, larger scale it is very dislocated from the SPX.

Guess what, none of the carry pairs are moving the market either, not the EUR/JPY, USD/JPY or AUD/JPY.


In fact everything you need to know about the late afternoon ramp can be found on these two charts.
 1 min manipulation

5 min accumulation.

Even Spot VIX looks to close green, all I can say is FARCE and Happy New Year!

I'll likely have something on internals before Thursday's open, although it likely won't be worth much.

Market Update

It's hard to tell if there's some tax selling here or what with volume so low. I feel the FAZ/SPXU longs today were timed pretty well, but intraday VXX I see a few things that makes me think they'll try to ramp the close or at least try to protect it from a red close.

A lot of charts are now looking really bad, especially in Industry groups such as Tech and Financials so I'm glad to see that.

However there is a clear intraday 1 min negative in VXX and VIX futures, this hasn't changed the 5 min which are stronger than when I posted them early, a nice clean leading positive divergence in VIX futures so the last hour of the year looks like if they get anything positive, it's just by gaming the system, but there's definitive demand for protection in to the new year, perhaps they fear for when volume picks back up and managers can unwind window dressing?

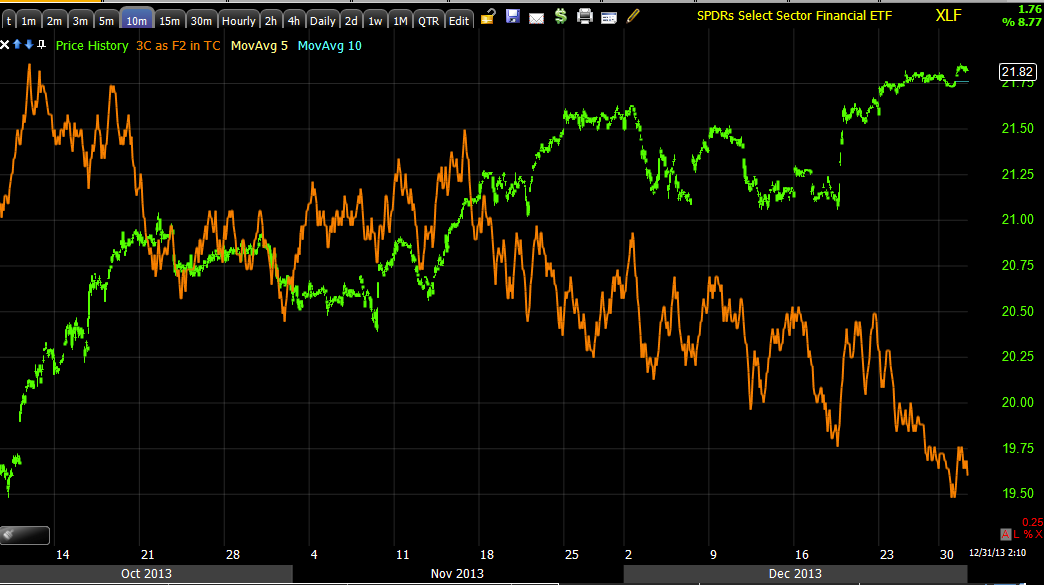
XLF Charts

There was some strange activity in VIX futures, as I showed earlier, the 5 min VIX futures BEVER went negative so I think yesterday/today was a pin, but suddenly today it's as if a large order moved right through several levels of the ask stack which is not surprising because despite the pinning of price, accumulation has still been evident.

Why buy VIX futures to protect gains with less than 2 hours left to the 2013 trading year?

In any case, there's more than just that, but I just didn't see reason to wait any longer on filling out FAZ (3x short Financials) as it was a 1/2 size position which was purposefully phased in to so the second half could be added if we got better prices which I suspected because of the shape of price and the lack of a "Chimney".

Take a look at the charts here though in XLF, it's one of those times that it's not a chart or a few charts that I just can't ignore, it's a cluster.

 Intraday 1min

2 min

10 min

15 min

30 min

How can I ignore that?

MCP follow Up / P/L

Here's the P/L for the closed out portion of MCP, with that base breakout it's very hard to close the entire position so you (I) make compromises.


At a fill of $5.55 the gain came out to just above +17.10% and 2200 of the 4200 were closed out.

There are several short term charts similar to this 3 min, not a big deal as far as the trend is concerned.

Trade Management : MCP

I LOVE, love, love, love MCP long, but I think there's a decent probability of a gap fill so I'm cutting MCP back to a half size trading position from a full size.

For Core MCP longs (trend trades), I'd leave it alone, I think it will be fine and there's no reason to try to cut too much around the bone, but for a trading portfolio, I'd rather protect some gains, still have some exposure and have a chance to add shares back at a lower cost basis.